
ETF Stats For March 2017: The S&P 500 ETF MegaPlex
Is there any doubt the S&P 500 Index is the most popular investing index in the world? As you probably know, the SPDR S&P 500 ETF (SPY) is the largest ETF on the planet, with $240 billion in assets. However, you may not be aware that the same index is targeted by the second largest ETF, the iShares Core S&P 500 ETF (IVV). In March, the assets in IVV grew to $102 billion, making it only the second ETF to cross the elusive $100 billion threshold.
In the ETF world, where transactions take place on a stock exchange, there is really no need to have multiple ETFs targeting the same index. An exception might be when expense ratios are high, inviting competition, but that doesn’t seem to be the case here. Additionally, the Vanguard S&P 500 ETF (VOO) is a third ETF tracking the same index. VOO is no slouch when it comes to size either, as its $64 billion in assets places it fifth on the largest U.S. ETF list. Therefore, three of the five largest ETFs all track the same S&P 500 Index.
Combined, these three ETFs control more than $400 billion of assets, or more than 14% of the entire U.S. ETF industry. They are the S&P 500 ETF MegaPlex. They grab an even larger share of trading activity. In March, more than $484 billion worth of these ETFs changed hands. That means that 27.9% of all U.S. ETF trading activity is in S&P 500 ETFs. Think about that for a minute. These three ETFs hold $400 billion, yet $484 billion changed hands, for a single-month turnover of 121%. This is not the action of buy-and-hold investors.
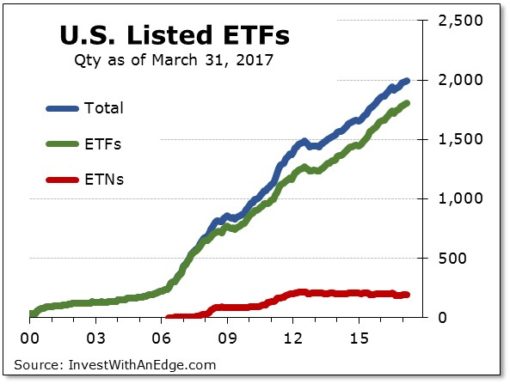
In the month of March, 17 new ETFs and ETNs arrived on the scene and 12 closed up shop. Another five had March 31 as their last day of trading, but they will be recorded as April closures. The month-end count of listed products now stands at 1,994, consisting of 1,803 ETFs and 191 ETNs.
Ten of the month’s new offerings are actively managed ETFs, raising their count to 177. Three others fit the smart-beta definition, pushing their total to nearly 700. However, perhaps the most surprising statistic regarding the new introductions is that seven of them are commodity funds.
Inflows came in at $33.8 billion for the month, putting the year-to-date total at $124 billion. Industrywide assets now add up to $2.79 trillion, and the steady climb to $3 trillion continues. Smart-beta ETFs now have $339 billion in assets, or about 10 times the $34 billion in actively managed ETFs.
ETF Stats for March 2017
| March 2017 Month End | ETFs | ETNs | Total |
|---|---|---|---|
| Currently Listed U.S. | 1,803 | 191 | 1,994 |
| Listed as of 12/31/2016 | 1,774 | 190 | 1,964 |
| New Introductions for Month | 16 | 1 | 17 |
| Delistings/Closures for Month | 11 | 1 | 12 |
| Net Change for Month | +5 | 0 | +5 |
| New Introductions 6 Months | 94 | 8 | 102 |
| New Introductions YTD | 43 | 3 | 46 |
| Delistings/Closures YTD | 14 | 2 | 16 |
| Net Change YTD | +29 | +1 | +30 |
| Assets Under Management | $2,770 B | $22.9 B | $2,793 B |
| % Change in Assets for Month | +1.8% | -1.0% | +1.7% |
| % Change in Assets YTD | +10.0% | +5.8% | +9.9% |
| Qty AUM > $10 Billion | 61 | 0 | 61 |
| Qty AUM > $1 Billion | 312 | 5 | 317 |
| Qty AUM > $100 Million | 880 | 35 | 915 |
| % with AUM > $100 Million | 48.8% | 18.3% | 45.9% |
| AUM Flows for Month | +$33.8 B | -$0.06 B | +$33.8 B |
| AUM Flows YTD | +$122.7 B | +$1.3 B | +$124.0 B |
| Monthly $ Volume | $1,678 B | $54.8 B | $1,733 B |
| % Change in Monthly $ Volume | +37.5% | +15.0% | +36.6% |
| Avg Daily $ Volume > $1 Billion | 9 | 0 | 9 |
| Avg Daily $ Volume > $100 Million | 90 | 6 | 96 |
| Avg Daily $ Volume > $10 Million | 332 | 10 | 342 |
| Actively Managed ETF Count (w/ change) | 177 | +8 mth | +14 ytd |
| Actively Managed AUM | $34.0 B | +5.5% mth | +13.6% ytd |
Data sources: Daily prices and volume of individual ETPs from Norgate Premium Data. Fund counts and all other information compiled by Invest With An Edge.
New products launched in March (sorted by launch date):
- VanEck Vectors Green Bond ETF (GRNB), launched 3/6/2017, seeks to track the S&P Green Bond Select Index, which includes only bonds flagged as “green” by the Climate Bonds Initiative. Green bonds are issued to finance projects that have a positive impact on the environment. The ETF has 41 holdings, an estimated yield of 1.2%, an effective duration of 6.3 years, and an expense ratio capped at 0.40% (GRNB overview).
- Global X U.S. Infrastructure Development ETF (PAVE), launched 3/8/2017, tracks an index that seeks to invest in companies that stand to benefit from a potential increase in infrastructure activity in the United States, including those involved in the production of raw materials, heavy equipment, engineering, and construction. PAVE will be added to the Infrastructure Pseudo-sector category of the ETF Field Guide. Its expense ratio is capped at 0.47% (PAVE overview).
- iPath Series B Bloomberg Natural Gas Subindex Total Return ETN (GAZB), launched 3/9/2017, is an ETN issued by Barclays that tracks the returns that are potentially available through an unleveraged investment in natural-gas futures contracts plus the rate of interest that could be earned on cash collateral. Its investor fee (expense ratio) is 0.45% (GAZB overview).
- Saba Closed-End Funds ETF (CEFS), launched 3/21/2017, is an actively managed ETF that seeks to generate high income by investing in a global portfolio of closed-end funds (“CEFs”) trading at a discount to net asset value and hedging the portfolio’s exposure to rising interest rates. It currently has 55% in fixed-income CEFs, 45% in equity CEFS, and the portfolio is leveraged up to 112.5% exposure. The total expense ratio of 2.42% consists of a 1.20% management fee and 1.32% in acquired fund fees (CEFS overview).
- Active Alts Contrarian ETF (SQZZ), launched 3/22/2017, an actively managed ETF that seeks current income and capital appreciation by investing in U.S.-listed equity securities of domestic and foreign issuers that are believed to be the subject of a “short squeeze.” A short squeeze occurs when investors who have sold short shares of an equity security seek to rapidly cover or buy back the short position due to actual or perceived appreciation in the security, which may occur because of positive news or events related to the company, its market sector, or the market generally. SQZZ has capped its expense ratio at 1.95% through August 31, 2018 (SQZZ overview).
- Hartford Corporate Bond ETF (HCOR), launched 3/22/2017, is an actively managed ETF that seeks to provide total return with income as a secondary objective. It invests in U.S. dollar-denominated investment-grade corporate bonds with a focus on bottom-up credit selection. It comes with an expense ratio of 0.44% (HCOR overview).
- Hartford Quality Bond ETF (HQBD), launched 3/22/2017, is an actively managed ETF seeking to maximize total return while providing a high level of current income consistent with prudent investment risk. It is a conservative, core bond ETF targeting investment-grade, fixed-income securities with an emphasis on quality. Its expense ratio is 0.39% (HQBD overview).
- O’Shares FTSE Russell International Quality Dividend ETF (ONTL), launched 3/22/2017, tracks an index of publicly listed large-capitalization and mid-capitalization dividend-paying developed-market international issuers exhibiting high quality, low volatility, and high dividend yields. The expense ratio is 0.48% (ONTL overview).
- iShares Core MSCI International Developed Markets ETF (IDEV), launched 3/23/2017, tracks the MSCI World ex-USA IMI Index of international developed markets (including Canada) with an expense ratio of 0.07% (IDEV overview).
- ProShares UltraPro 3x Crude Oil ETF (OILU), launched 3/27/2017, seeks daily investment results of three times (3x) the daily performance of the Bloomberg WTI Crude Oil Subindex. The ETF reports shareholder tax information with Schedule K-1, and it has an expense ratio of 0.95% (OILU overview).
- ProShares UltraPro 3x Short Crude Oil ETF (OILD), launched 3/27/2017, seeks daily investment results, before fees and expenses, that correspond to three times the inverse (-3x) of the daily performance of the Bloomberg WTI Crude Oil Subindex. The ETF reports shareholder tax information with Schedule K-1, and it has an expense ratio of 0.95% (OILD overview).
- CWA Income ETF (CWAI), launched 3/30/2017, is an actively managed ETF seeking total return by investing in a diversified portfolio of corporate bonds with varying maturities and up to 20% in high-dividend equity securities. It normally invests in investment-grade corporate bonds of large-cap domestic issuers, without a preference for particular market sectors. But it may also invest in securities of small- and mid-cap issuers, both foreign (including emerging markets) and domestic, in any market sector, regardless of credit quality. The ETF is from StrongVest, and Capital Wealth Advisors (“CWA”) is the subadvisor. Because of its ability to include equities, the ETF Field Guide will put CWAI in its Global Asset Allocation category. The ETF comes with an expense ratio of 0.75% (CWAI overview).
- Direxion Auspice Broad Commodity Strategy ETF (COM), launched 3/30/2017, is an actively managed ETF that seeks returns exceeding that of the Auspice Broad Commodity Index over a complete market cycle. It intends to take advantage of rising commodity prices and mitigate risk by going flat (cash) when individual commodities are experiencing downward trends. It seeks to provide commodity investment returns with lower risk characteristics than long-only commodity strategies. Futures contracts are held by a Cayman subsidiary, allowing the ETF to issue 1099 tax statements. The expense ratio is capped at 0.70% (COM overview).
- Arrow Reserve Capital Management ETF (ARCM), launched 3/31/2017, is an actively managed ETF seeking to preserve capital while maximizing current income. It invests in domestic fixed-income securities rated Baa- or higher with a dollar-weighted effective average maturity of 0 to 2 years. It may also invest in interest-rate futures and forwards to gain exposure or hedge interest-rate risk, and it has an expense ratio of 0.38% (ARCM overview).
- ETFS Bloomberg All Commodity Longer Dated Strategy K-1 Free ETF (BCD), launched 3/31/2017, is an actively managed ETF that seeks to provide a total return designed to exceed the performance of the Bloomberg All Commodity Index 3 Month Forward. This ETF buys and sells futures contracts via a Cayman subsidiary, allowing it to issue 1099 tax statements. The expense ratio is 0.29% (BCD overview).
- ETFS Bloomberg All Commodity Strategy K-1 Free ETF (BCI), launched 3/31/2017, is an actively managed ETF that seeks to provide a total return designed to exceed the performance of the Bloomberg Commodities Index. This ETF buys and sells futures contracts via a Cayman subsidiary, allowing it to issue 1099 tax statements. The expense ratio is expense ratio of 0.29% (BCI overview).
- ETFS Bloomberg Energy Commodity Longer Dated Strategy K-1 Free ETF (BEF), launched 3/31/2017, is an actively managed ETF that seeks to provide a total return designed to exceed the performance of the Bloomberg Energy Index 3 Month Forward. This ETF buys and sells futures contracts via a Cayman subsidiary, allowing it to issue 1099 tax statements. Its expense ratio is 0.39% (BEF overview).
Product changes in March:
- Effective March 13, Global X MSCI Nigeria (NGE) became more of a Broken Product by reducing its daily limit of creation units from two to one.
- On March 13, AdvisorShares announced that it would close and liquidate the AdvisorShares Athena High Dividend ETF (DIVI) with a last day of trading on March 24.
- On March 17, AdvisorShares issued a press release stating it had changed its mind and rescinded the previously announced closure plans for the DIVI ETF.
- On March 23, AdvisorShares announced the original plan to close DIVI will proceed, but the last trading day was pushed out to April 3.
Disclosure: more


