Equity Relative Strength Vs Bonds Testing Resistance
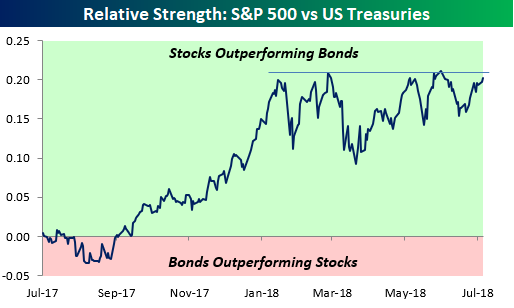
The chart below is updated on a daily basis in our Morning Lineup report and shows the relative strength of the S&P 500 versus the price of the Treasury Long Bond Future over the last 12 months. In the chart, a rising line indicates that equities are outperforming long-term Treasuries and vice versa. As you can see in the chart, the final four months of 2017 saw a steady trend of equity outperformance right up until the January highs. You may recall that back in late January, sentiment towards equities was at multi-year highs while the overriding consensus was that Treasury yields were going to the moon, which would put bonds in a swoon.
Well, with the benefit of hindsight, we all know that stocks didn’t keep rallying and long-term Treasury yields fell (meaning bonds are up in price). In the last couple of weeks, though, equity performance has picked up steam and while the S&P 500 just cleared frustrating resistance at the 2,800 level in the last few days, equity relative strength is also making a move to test a resistance level that has been problematic over the last few months. Technicians often say that the more often a support or resistance level is tested, the weaker it becomes. That ultimately proved to be the case with 2,800 for the S&P 500 last week, and given all the tests in the relative strength chart below, we think resistance will eventually give way to a breakout here as well.
(Click on image to enlarge)