
Energy Stocks Testing Key Breakout Level, Says Joe Friday
Just The Facts- Energy ETF (XLE) has lagged the S&P 500 by a large margin over the past three years, reflected in the chart below.
(Click on image to enlarge)
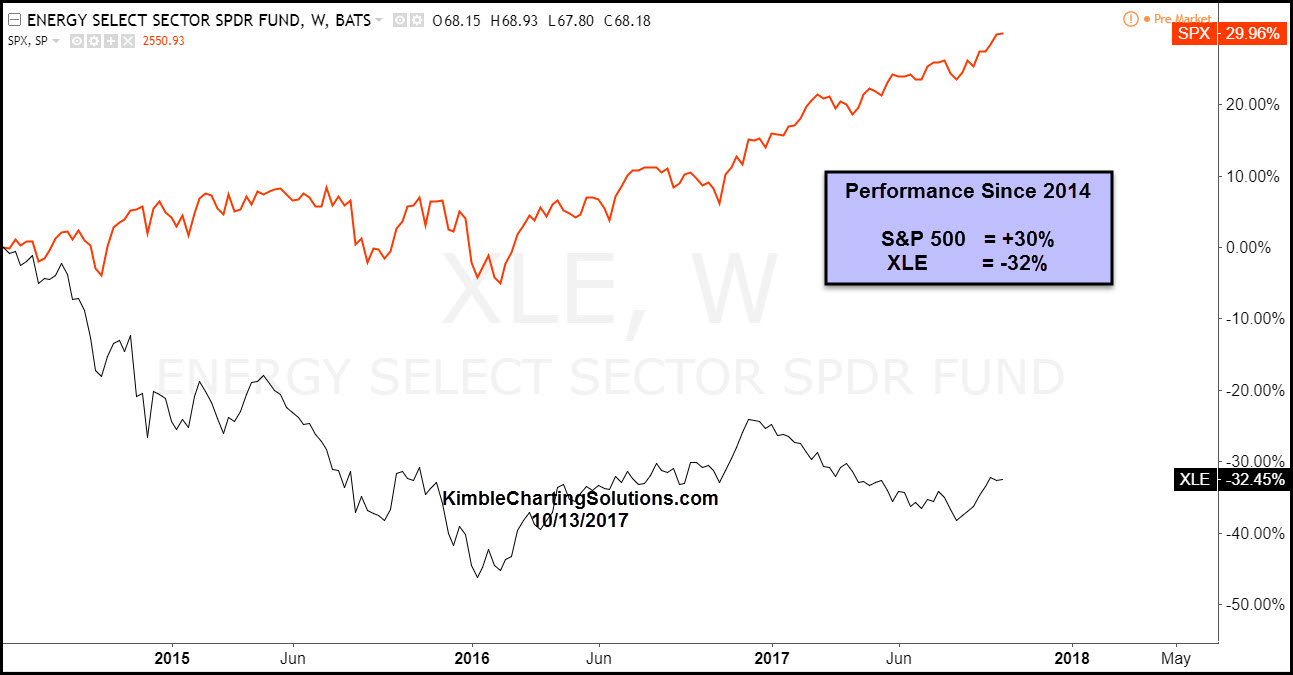
The chart above reflects that XLE has underperformed the S&P 500 by nearly 60% over the past three years. Could this large underperformance turn into an opportunity? Sure could! Check out the key test that is in play with XLE.
(Click on image to enlarge)
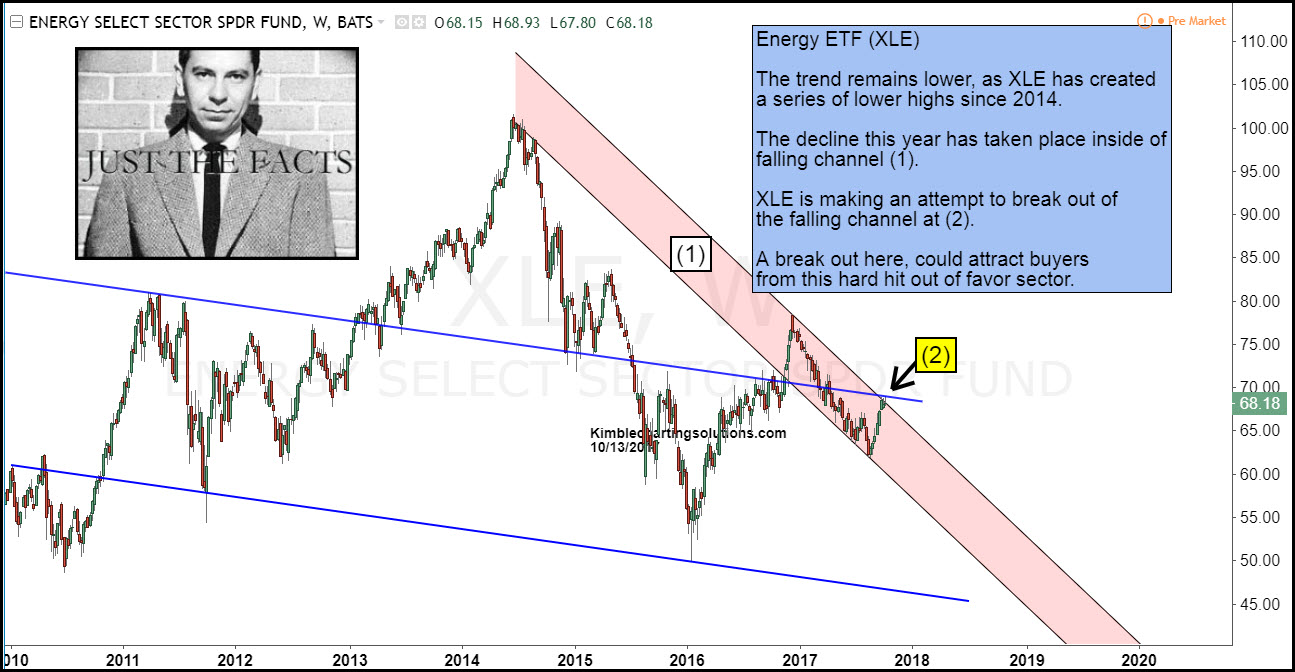
Joe Friday Just The Facts Ma’am– XLE is testing dual resistance this week at (2), at the top of falling channel (1). If XLE breaks out at (2), it should attract buyers!
Sign up for Chris's Kimble Charting Solutions' email alerts--click here.
How did you like this article? Let us know so we can better customize your reading experience.

Comments
Leave a comment to automatically be entered into
our contest to win a free Echo Show.

