Emerging Markets Are Back: Are You Accessing Them Efficiently?
We’ve previously made the case that state-owned enterprises (SOEs) in emerging markets (EM) are prone to conflicts between the interests of shareholders and government stakeholders, possibly affecting their profitability and future returns.
More recently, we showed how a non-SOE approach can give investors access to the quality factor, resulting in a smarter way to invest in the Chinese equity markets.
Having returned more than 37%1 in 2017, EM had its best performing year since 2009. Thanks to a solid economic outlook, many investors increasingly are considering adding to their EM exposure in 2018. In the past, investors did not have a choice between SOE and non-SOE exposure and had to approach EM using traditional beta. In 2014, we launched the WisdomTree Emerging Markets ex-State-Owned Enterprises Index (EMXSOE), which measures the performance of EM stocks classified as non-state-owned enterprises (less than 20% government ownership), creating exposure for those who want to focus on EM companies that are free of significant government ownership.
Is It Worth Owning State-Owned Enterprises?
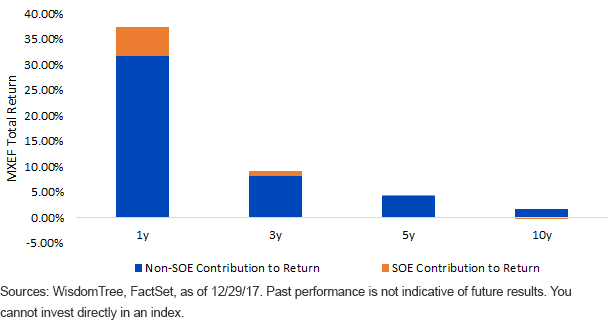
We looked to quantify the impact of SOEs on the return of the most commonly used EM benchmark, the MSCI Emerging Markets Index (MXEF). To do so, we split MXEF’s constituents into SOEs and non-SOEs and ran a contribution to total return analysis spanning multiple periods. Some of the biggest SOE names in the index are China Mobile, Sberbank of Russia, Gazprom and Petrobras.
MSCI Emerging Marketes Index (MXEF)
(Click on image to enlarge)

Shown in blue, non-SOEs have been the main driver of performance for MXEF over the past 10 years. During this period, the average weight of non-SOEs in MXEF’s portfolio has been 70%, yet they’ve contributed more than 90% of MXEF’s total return. The basket of non-SOEs in MXEF has outperformed the basket of SOEs by more than 18% during the last year and by 500 basis points (bps) annually for the past five years. This chart makes a compelling case for seeking a non-SOE exposure when allocating to EM.
Focusing Your Non-SOE Exposure in EM
To measure whether EMXSOE’s approach has been successful when compared to a traditional beta investment, we used the same SOE and non-SOE classification mentioned above.
(Click on image to enlarge)

Since its inception, EMXSOE has outperformed the MXEF by 371 bps annually. During this period MXEF’s average exposure to SOEs was close to 27%, which means EMXSOE had an active under-weight of 27% in that category. This under-weight and the corresponding over-weight in non-SOEs explain a good amount of EMXSOE’s excess return. In the right-most column, we can see how during this period MXEF’s non-SOE basket outperformed its SOE basket by more than 5% annually, furthering our case for a non-SOE focus.
How Does a Non-SOE Focus Alter Your Sector Tilts?
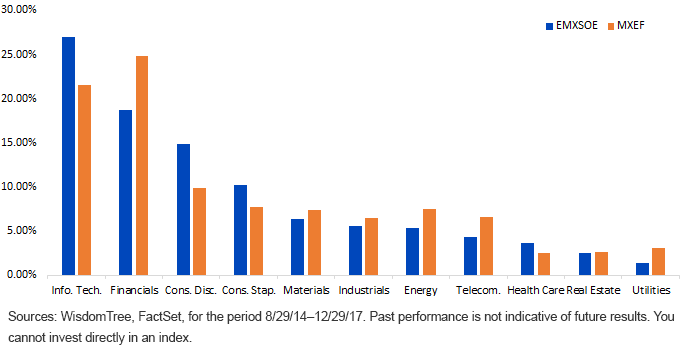
Given that historically a significant amount of SOEs have been concentrated in the Financials, Energy and Telecommunication Services sectors, one of the most immediate effects of focusing exclusively on non-SOEs has been under-weights in those sectors. In fact, since its inception in 2014, EMXSOE has been under-weight in those SOE-centered sectors and has been over-weight in the Information Technology, Consumer Discretionary and Consumer Staples sectors, which have little government involvement. The resulting sector over- and under-weights have resulted in excess returns for EMXSOE, as it has outperformed MXEF by 3.71% on an annual basis.
Average Sector Exposure
(Click on image to enlarge)

Non-SOEs as a Proxy for EM Quality
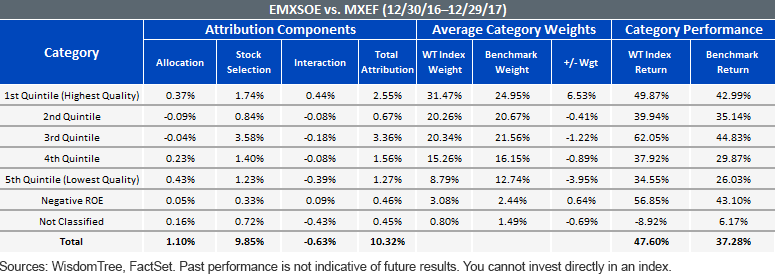
While conducting this analysis, we realized that companies with less government ownership have, on average, higher return on equity (ROE). Using our factor attribution framework, we can show how favoring non-SOEs is also a way to access the quality factor. Using ROE as a measurement for quality, we segmented the EM equity universe into five ROE quintiles, the first being the top 20% measured by ROE (representing the highest-quality segment of the market) and the fifth quintile being the bottom 20% (representing the lowest-quality segment).
(Click on image to enlarge)

Above we can see how EMXSOE’s non-SOE focus translates into a significant 6.5% over-weight in the highest-quality quintile with a corresponding 3.9% under-weight in the lowest-quality quintile. Year-to-date, EMXSOE has outperformed MXEF by more than 1,000 bps. The allocation column shows us how the focus on higher quality helps explain a portion of the excess returns.
Conclusion
We believe that non-SOE exposure is a more efficient way to approach EM equity markets. Investing in companies that have shareholder interests as a top priority has proven to be a way to tap into quality and the resulting sector tilts could lead to potentially higher expected returns.
Disclaimer: Investors should carefully consider the investment objectives, risks, charges and expenses of the Funds before investing. U.S. investors only: To obtain a prospectus containing this ...
more


