
Embracing The Below Average
What a boring day! As I’m typing this, the ES is up .12% and the NQ is down .12%. Average ’em out, and you get… a Saturday trading session. So I’ll just put up the good ol’ TLT chart, which is utterly core to my options portfolio (two positions – TLT and XLU January 2019 puts).
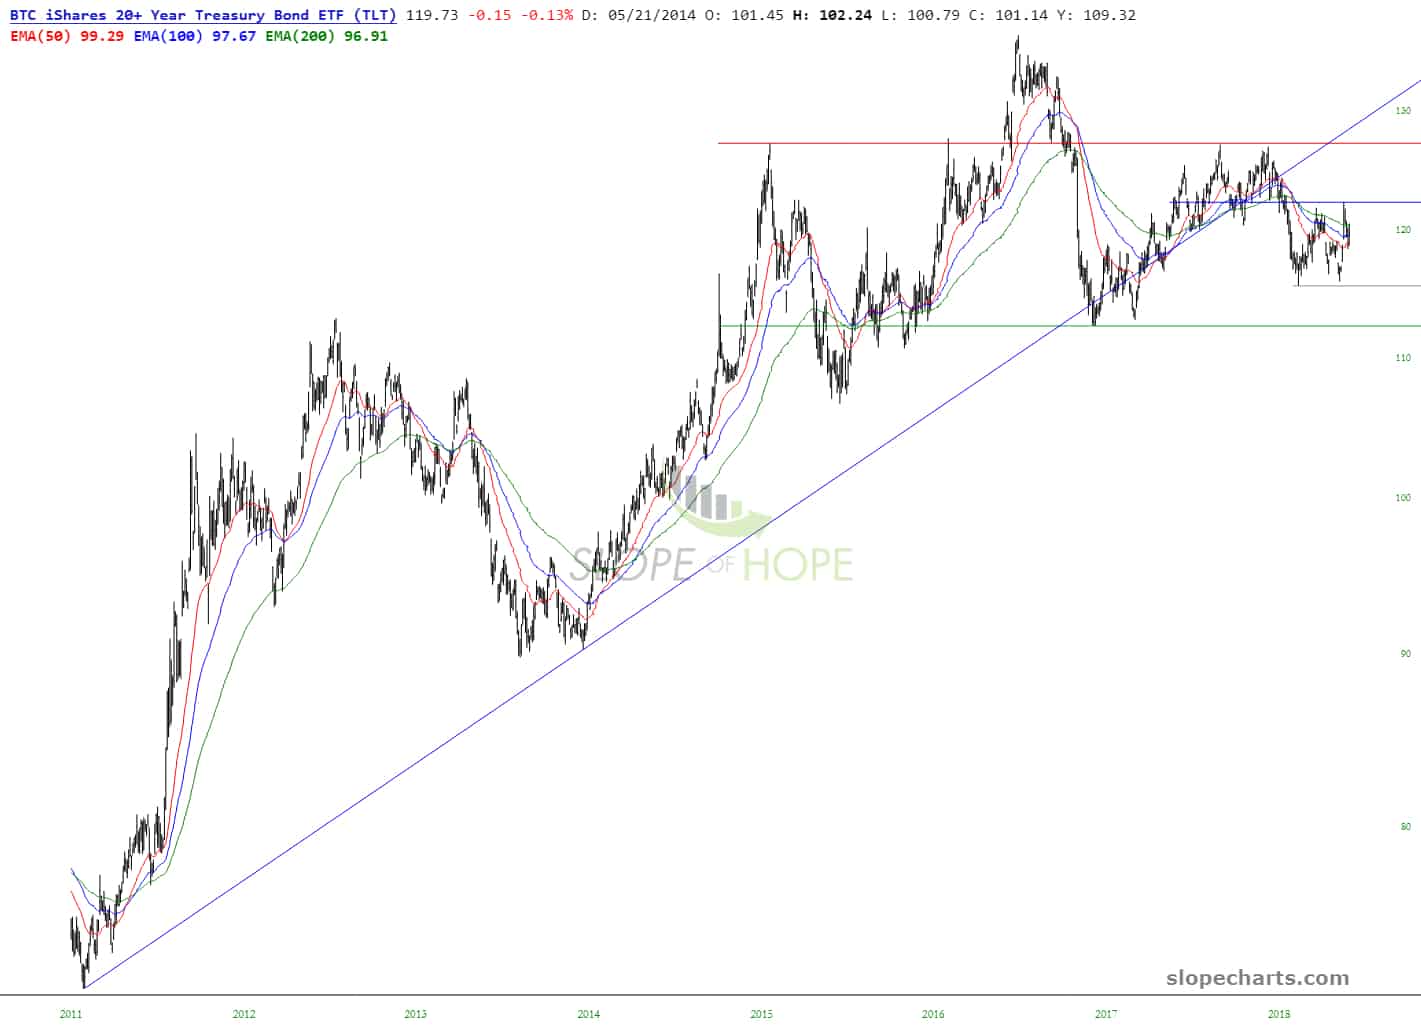
As shown below, it broken its trendline ages ago, and it’s about 90% done with what could be (if complete) one of the greatest topping patterns ever.
(Click on image to enlarge)
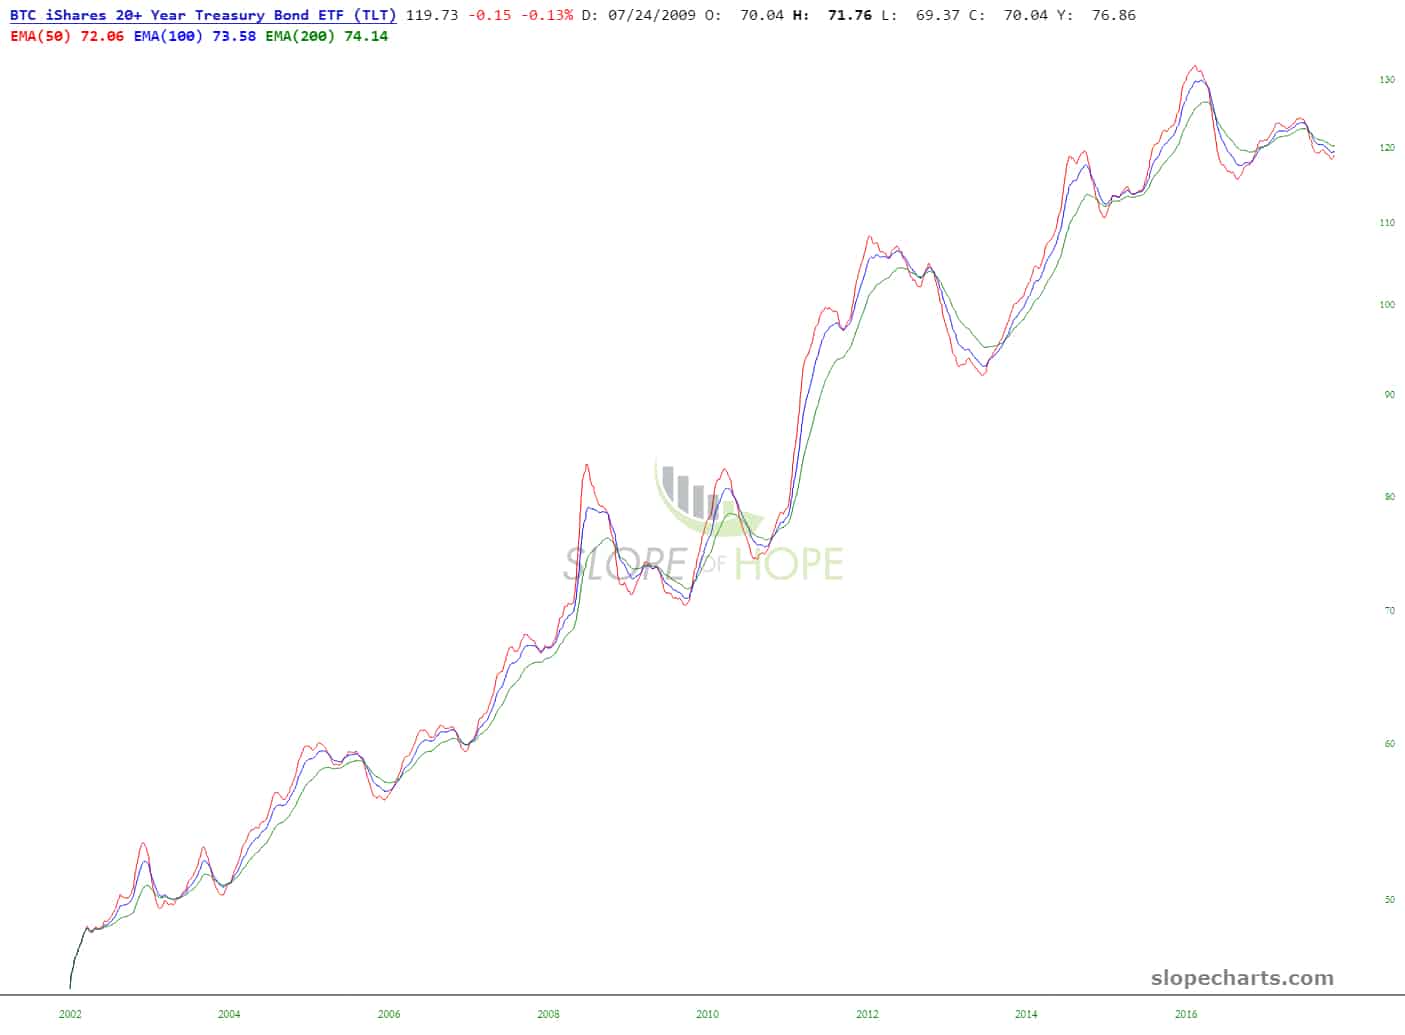
Stripping away the price data and drawn objects, you can see the trio of moving averages slowly pivot lower. The market could still be “saved”, of course, as it has before, but I am optimistic we’re at a major pivot point.
(Click on image to enlarge)
In sharp contrast to, oh, say, the Russell 2000 small caps.
(Click on image to enlarge)

As an aside, I’ll mention that stacked items in SocialTrade in the comments stream BEHAVE THEMSELVES now as I wanted originally – that is, instead of being thrown off to a different part of the site, you see the DIV window. There are a couple of bugs we’re working out in the window, but it’s 95% there, and a big improvement.
Disclaimer: This is not meant to be a recommendation to buy or to sell securities nor an offer to buy or sell securities. Before selling or buying any stock or other investment you should consult ...
more

