
Earnings Season Kicks Into High Gear With Volatility At Record Low Levels
Do you remember August of 2017; it was only a few weeks ago? It was being heralded as the month that volatility would come back with a vengeance and after a rather subdued summer in the markets. Cries for a revisiting of August 2015, where volatility spiked from the low teens to the low 50s were resounding in the market place and on social media platforms. But it never came to be. As September rolled around, doomsayers feared the major averages had stretched far beyond historic price to earnings (PE) multiples and as geo-political tensions were heightening between North Korea, the United States and the U.N. Security Council. Again, these doomsday calls that would desire to see a market pullback of sorts and a spike in volatility fell on deaf ears. The major averages climbed higher, volatility sank into a period of historically low levels and doomsayers were cast aside in favor of improving economic and market sentiment.
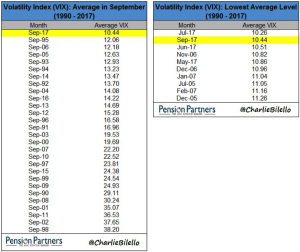
The summer and fall months have expressed record low levels of volatility in the marketplace. September volatility averaged 10.44 on the VIX and was the lowest average level for the month of September VIX on record.
Such record complacency in the markets is not just a factor of investor exuberance, but also a factor demonstrating just how much the landscape of the investor world has changed. From the proliferation and abundance of ETF and other passive investment vehicles to global central bank interactions with the financial markets; the world of investing has evolved to express a volatility loop that compresses lower with time. Think of the volatility loop as a big oval that compresses itself along the x-axis over time. The theory of “reflexive volatility” that has been chronicled for years, and more recently months on end, doesn’t’ allow for such a different perspective. Volatility “experts” express a belief that aligns with a circular volatility loop whereby what falls will rise reciprocally in kind. In some aspects of VIX language this is known better as a cyclicality that results in mean reversion. This would result in a beautifully round circle of volatility or VIX reading. Artemis Capital’s Chris Cole, bears no recognition of this potential model whereby volatility can still be reflexive, but to a degree that the volatility loop is compressed over time and until the true loop is recognized by an oval shaped loop. Let’s take a look at a statement Mr. Cole offered to the New York Times in a recent interview:
The fact that everyone has been incentivized to be short volatility has set up this reflexive stability — a false peace,” he said. “But if we have some sort of shock to the system, all these self-reflexive elements reverse in the other direction and become destabilizing as opposed to stabilizing.
In terms of the volatility loop, I’m of the opinion that it is generally best to think of the reflexive nature in the shape of an oval as opposed to a circular loop. Such a hypothesis is actually in line with the recognition of the natural order of volatility and expressed in the long-term VIX curve. Moreover, along the Y-axis volatility moves higher and lower. As such, the shape of the VOL loop may look something like this:

As we have come to learn over the last 25 years and with regards to the VIX, the oval volatility loop compresses over time. Such an expression of the VIX reading over time results in the following volatility loop graphic shape:

The latter graphic of the volatility loop is absent in the reflexive understanding or consideration perpetuated by those modeling for an eventual volatility nightmare. The reality is that a “nightmare” scenario whereby the VIX expands dramatically in any singular day or week is highly subjective and dependent on the investor’s participation. That’s a given. But what apparently isn’t a given is the theory for which many have modeled such an event or how the present the reflexive volatility loop to be more representative of the changing markets, investment vehicles and other variables at play.
Spikes in volatility are less frequent and occur with unsustainable velocity. Having said all of that the nature of volatility being what it is, modeling for future volatility remains a challenged exercise. The VIX has gone where no VIX has gone before, partly on the heels of record indices and partly as a result of the aforementioned factors. Admittedly, the uncharted waters for which we currently explore the VIX, in and of itself, are reasons enough to exercise a level of cautious curiosity for future reactions to what lay ahead.
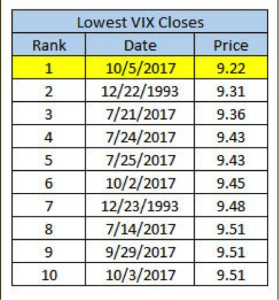
The narrative for the VIX, thus far in October, has not changed. What brought a record September 2017 VIX average of 10.44 has carried through the first trading week of October. In fact, the VIX has spent part of the day below 10 for a record 15 straight days and expressed a record closing low of 9.22 on October 5th as shown in the table below:
As investors entered the month of October, the major averages have found new, all-time highs, record closes for consecutive days and a seemingly endless complacency in the markets. But…but we all know that all good things, all good things built on a solid foundation that is also built to withstand a healthy amount of turbulence and otherwise objectionable headwinds, must be met with adverse conditions. Turbulence will come, headwinds will stoke fear/caution and ultimately investors will confront such obstacles as they always have. The resolve that comes from understanding that markets are built on strong economic fundamentals for which corporate earnings can grow into the future is the fabric of investor resolve. So let’s get to it, shall we?
With the S&P 500 at all-time highs we broadly enter earnings season as the “big banks” are set to report Q3 2017 results this week. Corporate earnings were bountiful in Q2 2017 and grew at a double-digit clip versus the same period a year ago. While that performance is not expected to be matched in Q3 2017, earnings are still expected to show growth in a relatively stable and growing economy. The estimates for S&P 500 earnings growth vary, but remain in the 3% range according to Thomson Reuters and Fact Set.
- Of the 23 companies in the S&P 500 that have reported earnings to date for Q3 2017, 87.0% have reported earnings above analyst expectations. This is above the long-term average of 64% and above the average over the past four quarters of 72%.
- Third quarter revenues are expected to increase 4.3% from Q3 2016. Excluding the Energy sector, the earnings growth estimate declines to 3.6%
- 78.3% of companies have reported Q3 2017 revenue above analyst expectations. This is above the long-term average of 59% and above the average over the past four quarters of 60%.
- For Q3 2017, there have been 77 negative EPS preannouncements issued by S&P 500 corporations compared to 48 positive EPS preannouncements. By dividing 77 by 48, one arrives at an N/P ratio of 1.6 for the S&P 500 Index.
- The forward four-quarter (4Q17 – 3Q18) P/E ratio for the S&P 500 is 18.0.
- During the week of Oct. 9, 10 S&P 500 companies are expected to report quarterly earnings
One of the major factors dragging on the earnings expectations for Q3 2017 is most obviously the impact from natural disasters that occurred during the quarter and most notably from Hurricane Harvey and Irma. Over the last month, the estimated earnings growth rate has fallen by some 2% in light of the natural disasters that weigh most heavily on the Insurance industry. In fact, the Insurance industry alone accounts for 77% of the decline in the estimated earnings for the S&P 500 for Q3 2017.
Analysts have lowered EPS estimates for companies in this industry due to the recent hurricanes and the earthquake in Mexico. Chubb Limited (CB), AIG (AIG), Everest Re Group (RE), XL Group (XL), and Allstate (ALL) have been the five largest contributors to the decline in earnings for this industry over this period. Estimates for the Airline industry have also been curtailed over the last month, but to a much lesser degree.
Over the past five years on average, actual earnings reported by S&P 500 companies have exceeded estimated earnings by 4.2%. During this same period, 69% of companies in the S&P 500 have reported actual EPS above the mean EPS estimate on average. As a result, from the end of the quarter through the end of the earnings season, the earnings growth rate has typically increased by 2.9 percentage points on average (over the past 5 years) due to the number and magnitude of upside earnings surprises.
In each of the two previous quarters, S&P 500 earnings grew at a double-digit clip with Q1 earnings growing 13.9% and Q2 earnings growing 10.3 percent. The typical Q3 earnings growth draw down may seem like a let down presently and even if actual earnings beat estimates, but that drawdown is expected to revert as it typically does during the seasonally strong Q4 period. At present, Q4 2017 earnings are expected to grow some 12.5% inclusive of the energy sector. In terms of valuing the S&P 500, the forward 12-month P/E ratio is 18.0, which is above the 5-year of 15.6 and the 10-year average of 14.1. It is also above the forward 12-month P/E ratio of 17.8 recorded at the start of the fourth quarter (September 30). In short, the markets are expensive on a historical basis, but history has not proven to be a guide for which to amend one’s market exposure to any significant degree as of yet.
Earnings season is among us, and yes, I do believe we will see a ramp in volatility during the season. That’s obviously easy for anybody to suggest given the sub-10 VIX reading that will be found going into earnings season. More importantly there are a great number of moving pieces still in play that have yet to be resolved on a macro level. Some of these pieces include tax reform, healthcare legislature that seems unsolvable, North Korea and a further out debt ceiling resolution in December. Earnings results will rule the day in the interim, but even that variable will likely breed some anxiety should the Financial sector (XLF) get off to a rough earnings season What I would also alert investors to are some key events taking place next week in the way of investor/analyst meetings held by Wal-Mart (WMT) on Tuesday and Kroger (KR) on Wednesday. Wal-Mart has been known to make sweeping announcements during such events, in the past, that have roiled the retail sector and major averages given its sheer size and relevance to the national economy. I expect to hear comments out of the retailer suggesting how it will compete going forward with the likes of Amazon.com (AMZN) and through a seismic shift in retail consumption. Remember folks, the U.S. consumer accounts for 2/3 of economic activity.
Tuesday and Wednesday’s analyst/investor meetings by the two retail giants will be followed by J. P. Morgan (JPM), Citigroup (C) and Domino’s Pizza (DPZ) earnings releases on Thursday. On Friday, the financial sector earnings parade continues with Bank of America (BAC) and Wells Fargo (WFC) both set to deliver their respective quarterly results. In the absence of sheer perfection in the quarterly reporting by the financials noted above, profit taking may be in sight and as such this activity could weigh on major averages near term. But as long as the reports themselves are clean, this profit taking will likely give way to the prevailing “buy the dip” mentality shortly thereafter. Cautiously optimistic has been the verbiage most widely used during this 2017 rally in markets and as earnings grow beyond the bracketed historic PE multiple for the S&P 500. Fighting the trend has proven futile. Fighting volatility with a bullish bias has also proven detrimental to investors who position as such, even to the extent they do so as a means of hedging risk.
This week’s economic calendar further layers onto the busy week ahead for investors. Below is a table of economic data releases spirited by MarketWatch.com.
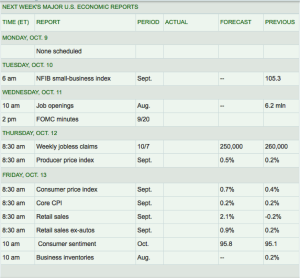
Wednesday’s FOMC minutes are highlighted and expected to be a noteworthy event while the week rounds out with Retail sales on Friday. Of course, of course those retail sales would come out on Friday the 13th; they’ve been rather lackluster in recent months. With Kroger and Wal-Mart both holding key analyst/investor events this week and Retail sales data on tap to conclude the week, I would expect fluctuations in the SPDR S&P Retail ETF (XRT) throughout the week and in response to these variables.
This earnings season comes with a great deal of expectations given market levels being where they are with respect to historic PE multiples. With that said I’ll throw two fingers up and wish all you traders and investors a bountiful trading week ahead.
Disclosure: None


Hi Seth! In this article you delve into points such as the vol loop that are very interesting. Thank you for your time and effort.