
DXY Index Remains In Consolidation In Lead Up To FOMC
The US Dollar (via the DXY Index) has made little progress thus far this week, the last full week of the calendar year 2018. But that's not a surprise, one way or the other, as the barren economic calendar on Monday and Tuesday left little reason for traders to make significant adjustments to positioning ahead of the December FOMC meeting on Wednesday.
WHAT TO EXPECT FOR FOMC TOMORROW
Following speeches by Fed Vice Chair Richard Clarida and Chair Jerome Powell in early-December, as well as the release of the November FOMC meeting minutes, expectations have started to build that the FOMC will slow down its pace of rate hikes moving forward.
Accordingly, attention tomorrow will be on the updated Summary of Economic Projections, where it seems very likely that: (1) 2018 and 2019 growth forecasts could be downgraded, in part due to growing trade war concerns; (2) 2018 and 2019 inflation forecasts could be downgraded, largely due to movement in the US Dollar and energy markets; and finally (3) the glide path for future rate hikes is reassessed, suggesting a slightly slower pace moving forward.
FED WILL ADDRESS GAP RELATIVE TO MARKET PRICING
At the September FOMC meeting, policymakers outlined a path of one more 25-bps hike in 2018, three hikes in 2019, and one hike in 2020. However, ahead of the December policy meeting, rates markets are pricing in one more 25-bps hike in 2018, one hike in 2019, and a rate cut in 2020. For the US Dollar to rally, the Fed will need to prove resilient to recent developments, thereby suggesting markets are underpricing the risk of future hikes. Otherwise, the base case scenario of a ‘dovish hike’ doesn’t seem ready to help the US Dollar rise any further.
DXY INDEX PRICE CHART: DAILY TIMEFRAME (JUNE TO DECEMBER 2018) (CHART 1)
(Click on image to enlarge)
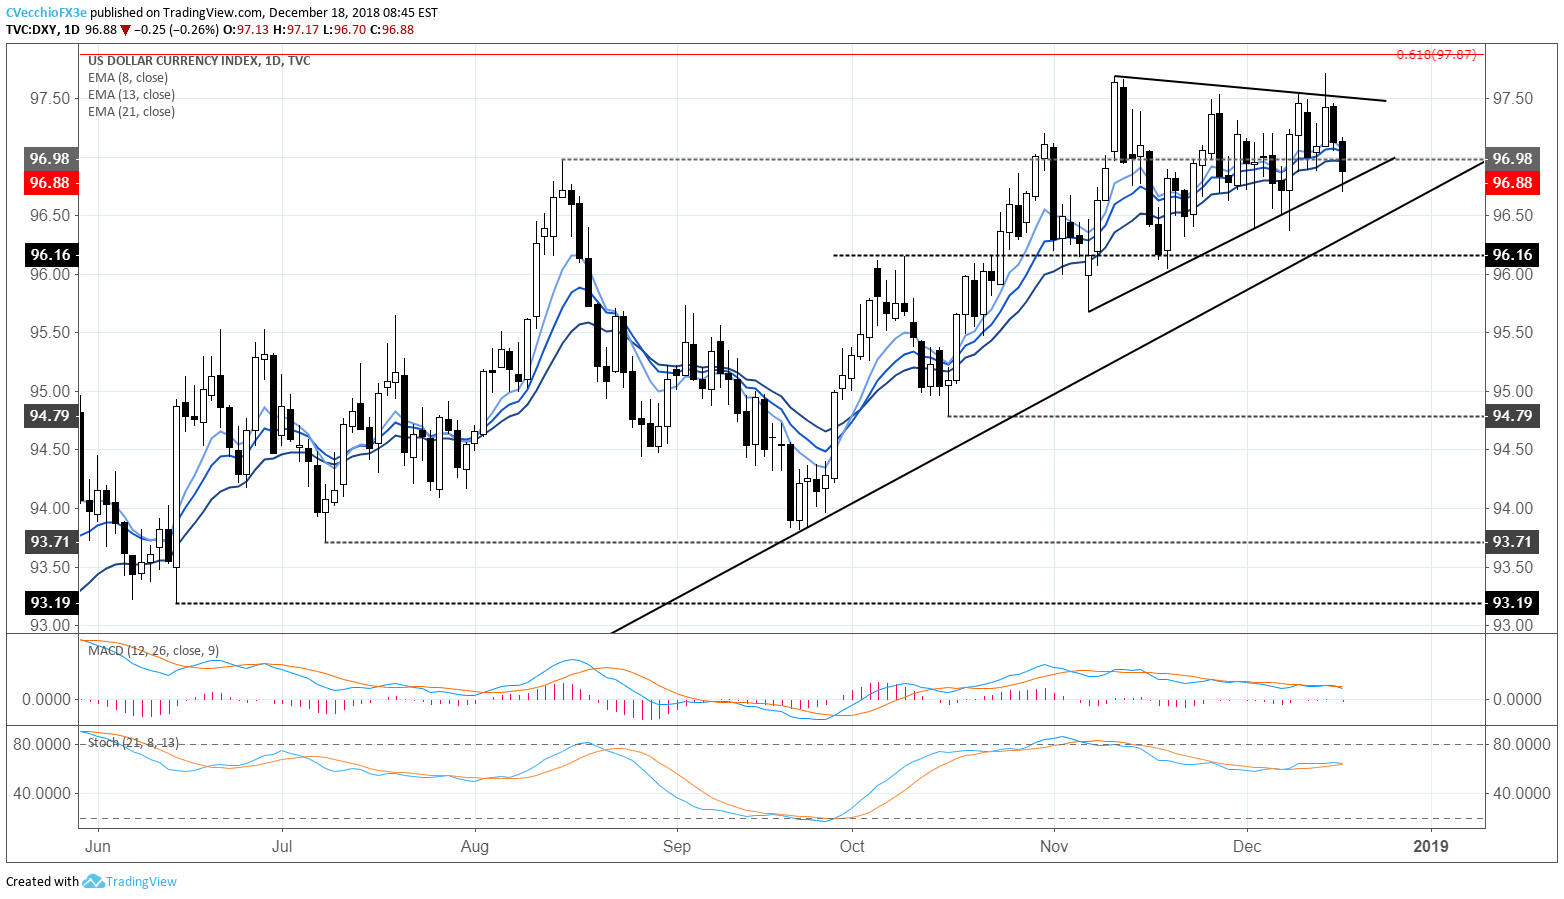
As it were, the symmetrical triangle in place since the end of November remains the central focus. For bulls, the November 28 bearish outside engulfing bar at 97.54 would need to be overcome to validate a bullish breakout. Conversely, given that the December 10 bullish outside engulfing bar's low came in at the daily 50-EMA - a level of trend support tested and held on numerous occasions since first breaking above it on September 27 - validation for a bearish breakout would need to come in below 96.36. For now, we have no bias as to which way the triangle breaks.
Disclosure: Do you want to see how retail traders are currently trading the US Dollar? Check out our IG Client Sentiment ...
more

