
DXY Index Hovering Below Fresh Yearly Highs Ahead Of July US CPI
The US Dollar (via the DXY Index) has made very little progress this week, not entirely unsurprising given the relatively quiet economic calendar. But the end of the week may see a change in trading conditions as the only 'high' rated event on the economic calendar is due out when the July US Consumer Price Index is released on Friday.
While the first full week of August has thus produced numerous important developments, including more tariffs in the US-China trade war, signs that China is letting the Yuan devaluation go unchecked, and the Reserve Bank of New Zealand crushing speculation of a rate hike before 2020, neither a single nor a series of developments has led to any significant movement in rate hike expectations for the Federal Reserve's September policy meeting.
Coming into the week, there was a 90% chance of a 25-bps rate hike in September and a 65% chance of another hike in December. Ahead of the release of the July US CPI report, odds are up at 92% for a rate hike in September. There are two takeaways here.
First, there is still room for a September hike to be priced in further, if only marginally; the upside potential is limited. Conversely, and secondly, because rate hike odds are so high, a 'miss' on the headline inflation will likely generate a bigger reaction in price than a 'beat' would.
As it were, if inflation comes in at +2.9% y/y again, then it will be outpacing wage growth at +2.7% y/y, leading to the unenviable scenario of a negative real wage growth trend starting to set in for the US economy. This will only further reinforce the idea that more rate hikes are necessary, beyond what is expected in September. December rate hike odds will soon start to hold more influence over the DXY Index than September rate hike odds.
DXY Index Price Chart: Daily Timeframe (July 2017 to August 2018) (Chart 1)
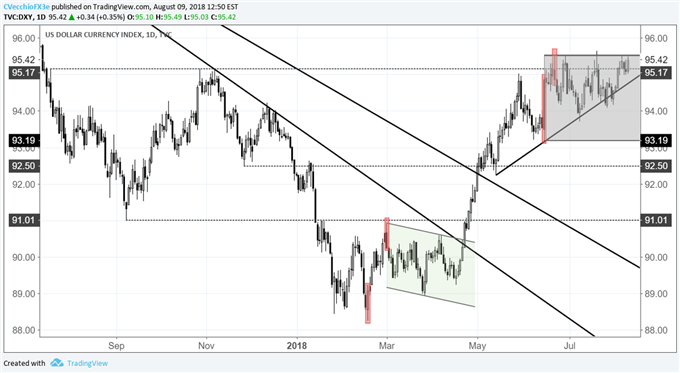
Technically speaking, the US Dollar's (via DXY Index) posture has continued to improve now that price is again above its daily 8-, 13-, and 21-EMAs. Both daily MACD and Slow Stochastics have confirmed 'buy' signals in bullish territory after price developments through the first three days of the week.
A breakout resulting from the bullish ascending triangle forming would only be valid given a move through the June 21 bearish daily key reversal and June 27 to 29 evening doji star candle cluster highs at 95.53 - the key level to watch for through the end of this week. Concurrently, we'll want to see the largest component of the DXY Index, EUR/USD (at 57.6%), break below 1.1510.
Disclosure: Do you want to see how retail traders are currently trading the US Dollar? Check out our IG Client Sentiment ...
more

