
Downtrend To Continue?
The U.S. stock market indexes lost 0.7-0.8% on Friday, retracing some of their early August advance, as investors reacted to global stock markets' rout. The S&P 500 index broke below its relatively narrow three-day-long trading range following bouncing off the resistance level of around 2,860-2,865. It currently trades 1.4% below the January's 26th record high of 2,872.87. The Dow Jones Industrial Average lost 0.8% and the technology Nasdaq Composite lost 0.7% on Friday.
The nearest important level of support of the S&P 500 index is now at around 2,820-2,825, marked by some previous local highs. The next support level is at 2,800. On the other hand, the nearest important level of resistance is at 2,845-2,850, marked by Friday's daily gap down of 2,842.20-2,851.98. The resistance level is also at 2,870-2,875, marked by the mentioned January's all-time high.
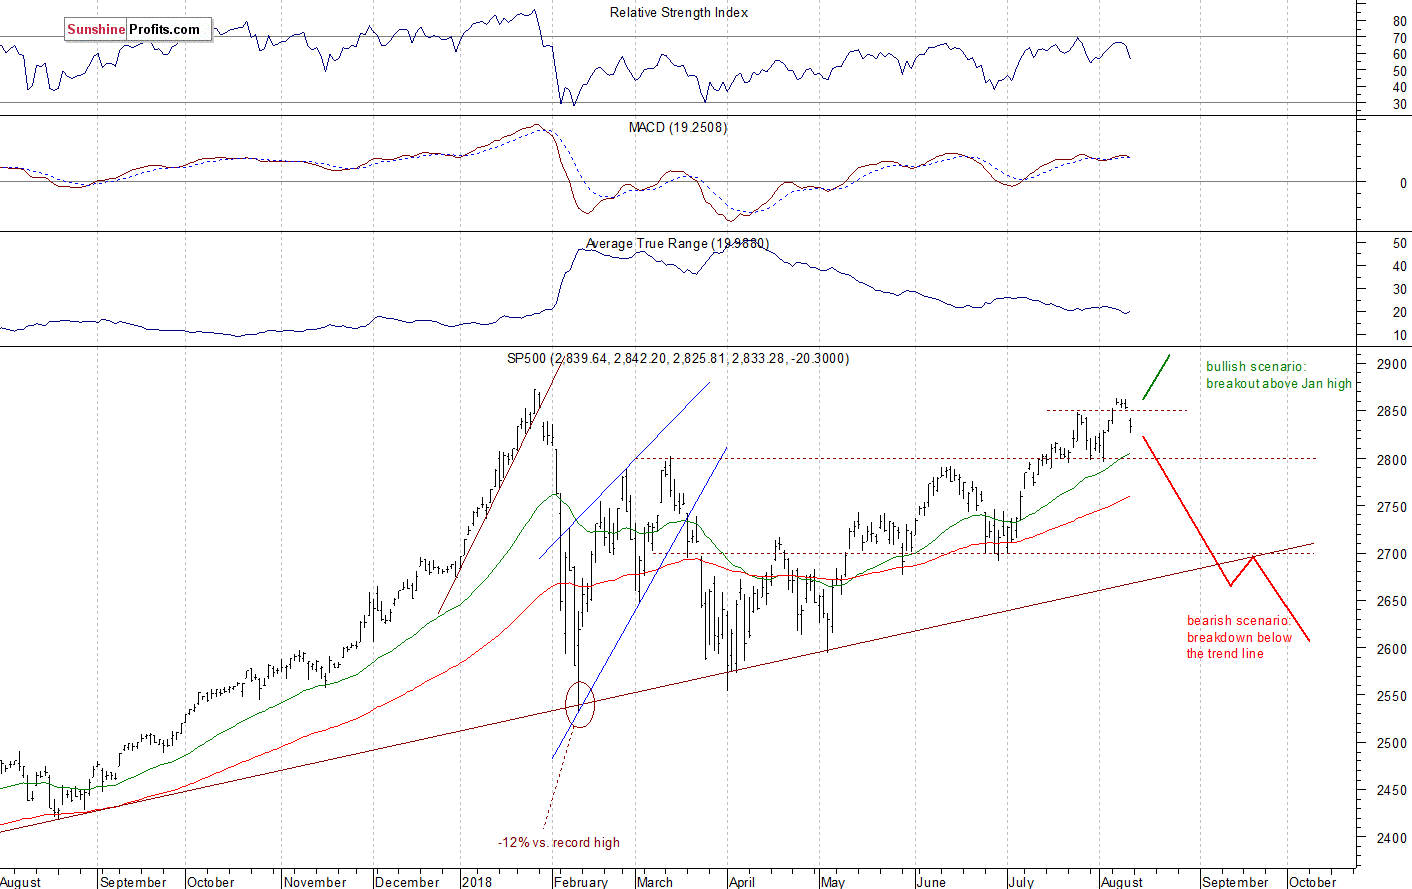
The broad stock market got close to its January's record high recently, as investors' sentiment improved following quarterly corporate earnings, economic data releases. The S&P 500 index traded within a relatively narrow trading range on Tuesday-Thursday's last week. Then it broke lower on Friday. Was it some medium-term downward reversal or just downward correction before another leg up? There are still two possible medium-term scenarios - bearish that will lead us towards the February low again, and the bullish one - breakout higher towards 3,000 mark. The latter one got very real recently. However, the S&P 500 index bounced of the resistance level marked by the mentioned January's record high last week:
(Click on image to enlarge)
Slightly Negative Expectations
Expectations before the opening of today's trading session are slightly negative, because the index futures contracts trade 0.3% below their Friday's closing prices. The main European stock market indexes have lost 0.3-0.7% so far. There will be no new important economic data announcements today. The broad stock market will probably fluctuate following Friday's decline. The S&P 500 index may bounce off the support level of around 2,820-2,825, marked by the previous local highs. However, there have been no confirmed short-term positive signals so far.
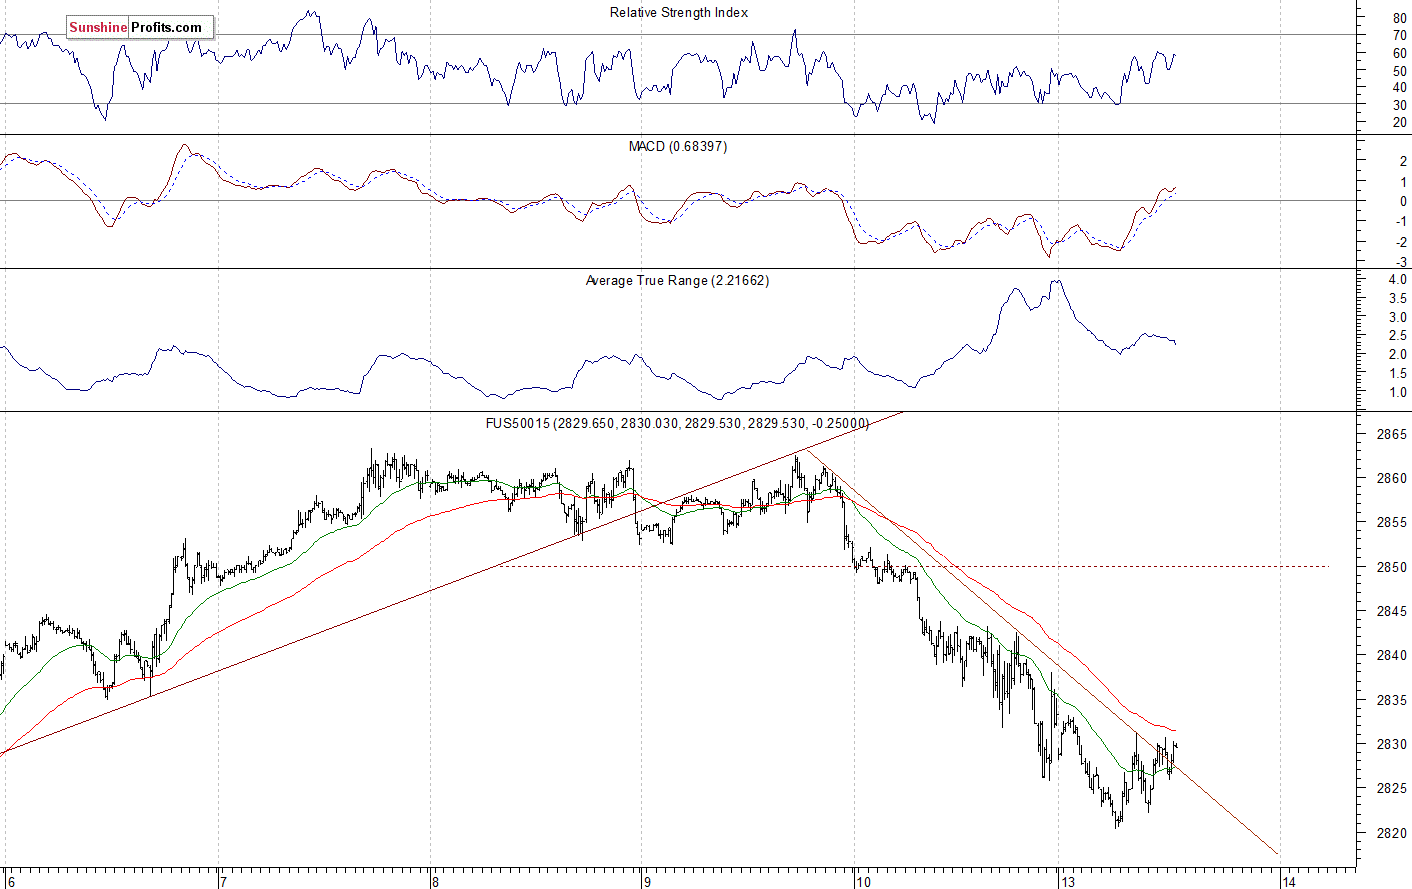
The S&P 500 futures contract trades within an intraday consolidation following Friday's decline. The nearest important level of support is a now at 2,820, marked by the local low. On the other hand, level of resistance is at 2,835-2,840, marked by some Friday's intraday local highs. The resistance level is also at 2,850. The futures contract trades along its short-term downward trend line, as we can see on the 15-minute chart:
(Click on image to enlarge)
Nasdaq Also Lower
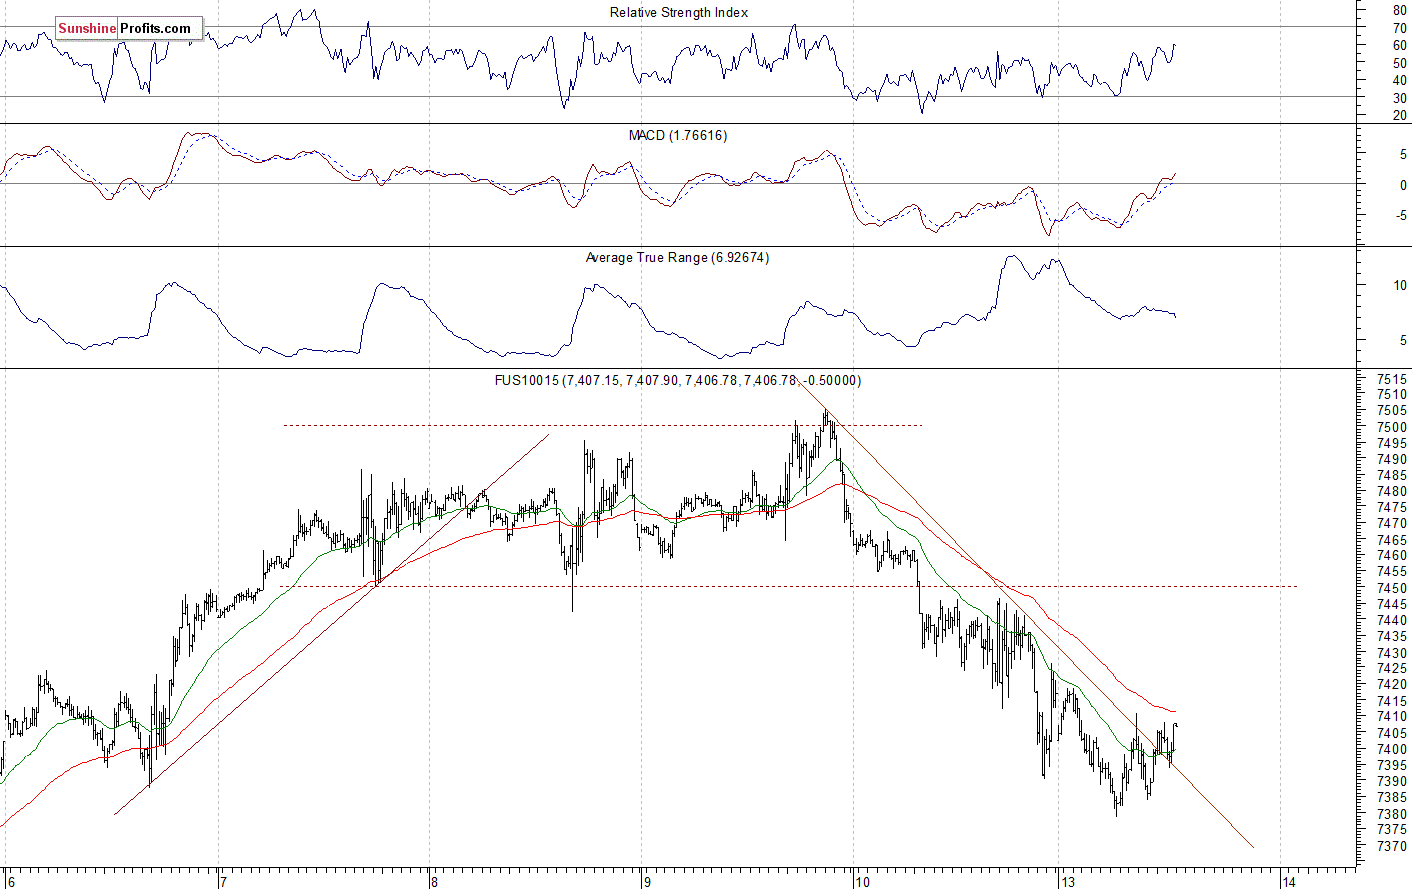
The technology Nasdaq 100 futures contract follows a similar path, as it trades within an intraday consolidation. The market bounced off the resistance level of around 7,500 on Thursday, and then it continued lower on Friday. The nearest important level of support is now at around 7,380, marked by the local low. The support level is also at 7,300-7,350. On the other hand, the resistance level is at 7,430-7,440, marked by the recent fluctuations. The next level of resistance is at 7,480-7,500. The Nasdaq futures contract trades below its last week's short-term consolidation along the level of 7,480-7,500, as the 15-minute chart shows:
(Click on image to enlarge)
Big Cap Tech Stocks Still Close to Record Highs
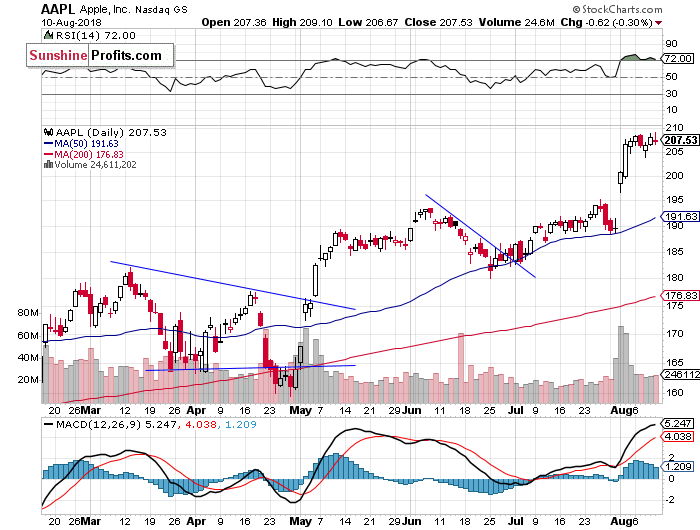
Let's take a look at Apple, Inc. stock (AAPL) daily chart (chart courtesy of http://stockcharts.com). The stock reached new record high on Friday at the level of $209.10, but it got back lower before the session's close. It will likely retrace more of its recent rally today following the broad stock market weakness. There have been no confirmed negative signals so far. The nearest important level of support is now at $190-200, marked by the previous resistance level:
(Click on image to enlarge)
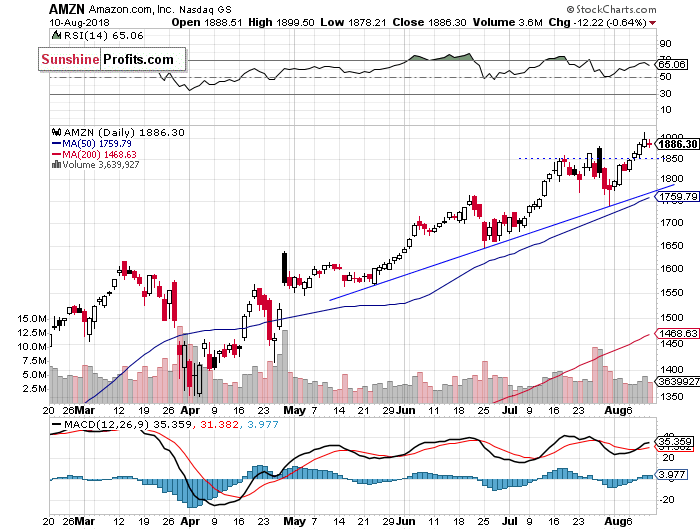
Now let's take a look at Amazon.com, Inc. stock (AMZN) daily chart. It reached yet another new record high on Thursday at the level of $1,914.57 following the recent breakout above the price of $1,850. The nearest important level of resistance remains at around $1,900-1,915. On the other hand, support level is at 1,850. The stock continues to trade above its medium-term upward trend line, as we can see on the daily chart:
(Click on image to enlarge)
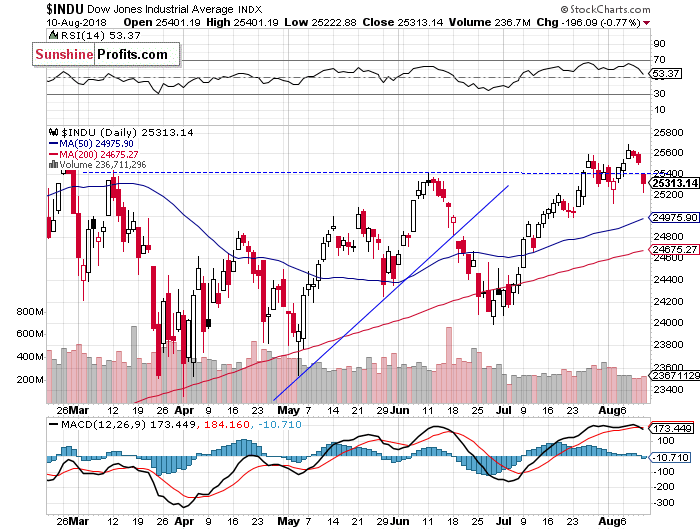
Dow Jones Got Back Lower
The retraced some of its recent advance on Friday, as it got back below the level of 25,500. The blue-chip stocks' gauge continues to fluctuate following its July rally. Is this just a flat correction within an uptrend or some topping pattern before downward reversal? For now, it looks like a flat correction before another medium-term leg up, because there have been no confirmed negative signals so far:
(Click on image to enlarge)
The S&P 500 index fell below its three-day-long consolidation on Friday, as investors reacted to an overnight global stock markets' rout. The broad stock market retraced some of its early August advance. So is this a new downtrend or just downward correction? For now it looks like a downward correction, and the support level remains at around 2,800.
Concluding, the broad stock market will likely open slightly lower today. The S&P 500 index may fluctuate along its late July short-term consolidation. It may act as a support level. For now, it looks like a downward correction following the early August advance.
Disclosure: None.


