
Dollar Softens To Support - Is The Bullish Move Ready To Run?
On Monday, we looked at the continued top-side breakout in the US Dollar; and after the Greenback set a fresh 8-month high yesterday, a disappointing Consumer Confidence print out of the U.S. has helped to drive the Dollar to the ‘S1’ zone of support that we’ve been looking at.
But taken in context, the month of October has seen a big move-higher in the U.S. Dollar, with only brief periods in which strength wasn’t present. The move, of course, has been driven by more-hawkish Federal Reserve commentary that has helped to stoke expectations for an interest rate hike out of the bank before the end of the year. Given that the Fed has only two meetings remaining in 2016, and also given that one of those meetings is just a week away, and one week ahead of U.S. Presidential elections, and deductively there’s pretty much only one meeting in which markets might expect a hike out of the Fed. As of now, markets are currently pricing in an approximate 71.4% chance of a rate hike out of the Fed in December. As these expectations have grown stronger throughout the month, so has the bullish move in the U.S. Dollar.
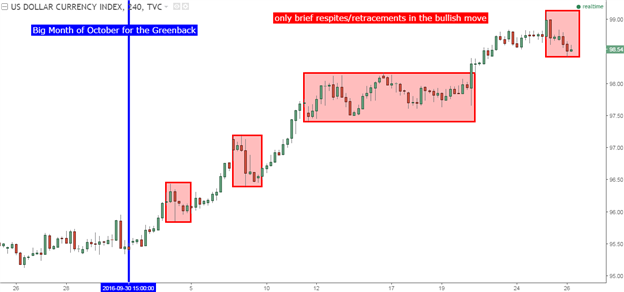
Chart prepared by James Stanley
To put into scope how motivated markets have been to drive this Dollar-move higher, last night saw the first support break of a ‘higher-low’ on the 4-hour chart of the U.S. Dollar. So, each time that the Greenback has moved lower towards support during the month of October, traders have rushed in to buy. That is, of course, until this morning. And this can speak to the nature of the trend, how much motivation is behind the move and how much continuation potential that ‘theme’ may offer.
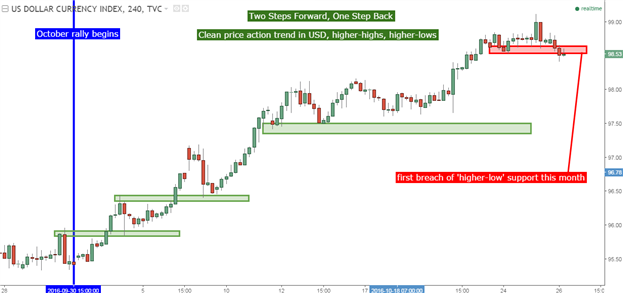
Chart prepared by James Stanley
With the U.S. Dollar Now Facing Pressure, Where Can We Look for Support to Develop?
Given recent price action, traders can look to an assortment of support levels in the effort of timing an entry into the next wave of USD-continuation. While price action has attempted to develop support at the same ‘S1’ zone that we’ve been watching since Monday, sellers have been showing up to fade the move. So, it doesn’t appear that continuation potential is showing just yet. However, a bit deeper into support are three additional levels (S2-S4 on the below chart) that traders can look to in the effort of catching top-side USD-continuation.
On the chart below, we’re looking at the U.S. Dollar with a trend-line applied that’s offered multiple support hits since its inception earlier in October. Above this trend-line are three additional areas of possible support for traders to watch for bullish Dollar continuation strategies:
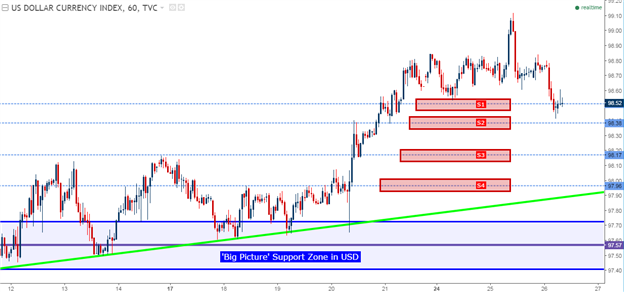
Chart prepared by James Stanley
If Looking to Buy the Dollar – Which Currency Might Traders Look to Sell Against?
There are two currencies that ‘stick out’ for such a theme at the moment, and those are Canadian Dollars and Japanese Yen. Behind both currencies are the expectations or even the hope that the representative Central Bank may come to the table with more stimulus. In Canada, we’ve heard the BoC mention this already at last week’s meeting, and the Canadian Dollar has been extremely weak ever since. In Japan, we’ve had less by the way of ‘telling information’ and much more by the way of speculation that the BoJ will, inevitably, end up coming to the table with more. We just don’t know the ‘how, when or what’ yet.
Despite the past ~24 hours of pullback in the US Dollar, USD/CAD has remained strong. After a quick dip to support (near old resistance) yesterday afternoon, CAD weakness has propelled the pair right back towards prior highs. This can bring on a daunting scenario in which the traders is attempting to get long whilst near-highs, but by scrolling in on the chart to look at the one-hour time-frame, traders may be able to get a look with greater granularity.
On the one-hour chart below, we’re looking at short-term range that’s developed in USD/CAD over the past couple of days. Traders can look to trade the range on the short-term chart in consideration of the trending bias on the long-term chart. Or, to put it otherwise, traders can assign a trend-side bias to the range by looking to buy support only, and then using resistance to tighten up risk or perhaps scale-out of a portion of the position.
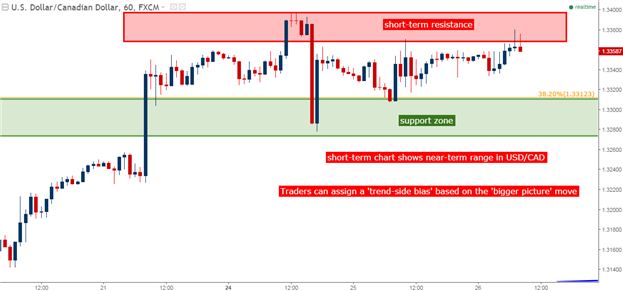
Chart prepared by James Stanley
The Yen hasn’t been nearly as weak as the Canadian Dollar of recent as the Bank of Japan hasn’t been nearly as open on the matter of oncoming stimulus as their Canadian counter-parts. This can open up the potential to a larger ‘big picture’ move should the BoJ begin discussing the prospect of more stimulus in the future, and the potential for such a theme to play-out is likely leading to at least some of the Yen weakness that we’ve seen through October.
On the chart below, we look at the one-hour setup in USD/JPY with short-term support and resistance zones indicated.
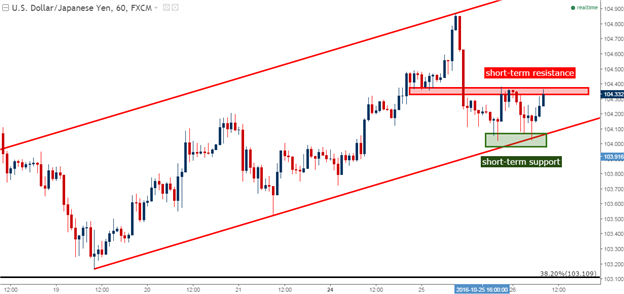
Chart prepared by James Stanley
Continue tracking these setups and more throughout the week- Subscribe to more


