
Doc Copper Vulnerable To Fall Hard From Here
(Click on image to enlarge)
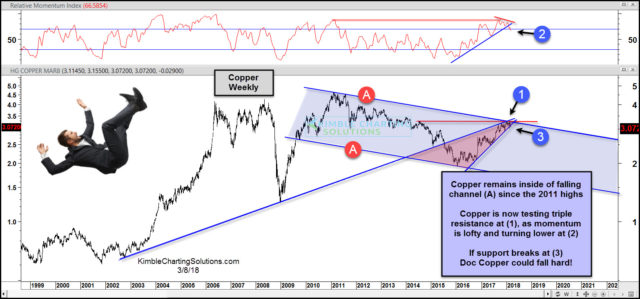
Doc Copper peaked in 2011 and has remained inside of falling channel (A) ever since. It hit the bottom of the channel in 2016 and a 2-year rally has been in play.
The rally now has Doc Copper testing the top of falling channel (A) and the apex of a bearish rising wedge as momentum has reached levels last seen at the highs in 2011.
If Doc Copper breaks support at (3), it could slip and fall!
Below looks at the position of traders in the copper market from Sentimentrader.com
(Click on image to enlarge)

Over the past 10-years when traders were positioned as they are currently at (1), Copper a few times was closer to a high than a low.
This crowded trade suggests that if Doc Copper would break support at (3) in the top chart, it could take a hard fall.
Sign up for Chris's Kimble Charting Solutions' email alerts--click here.


