
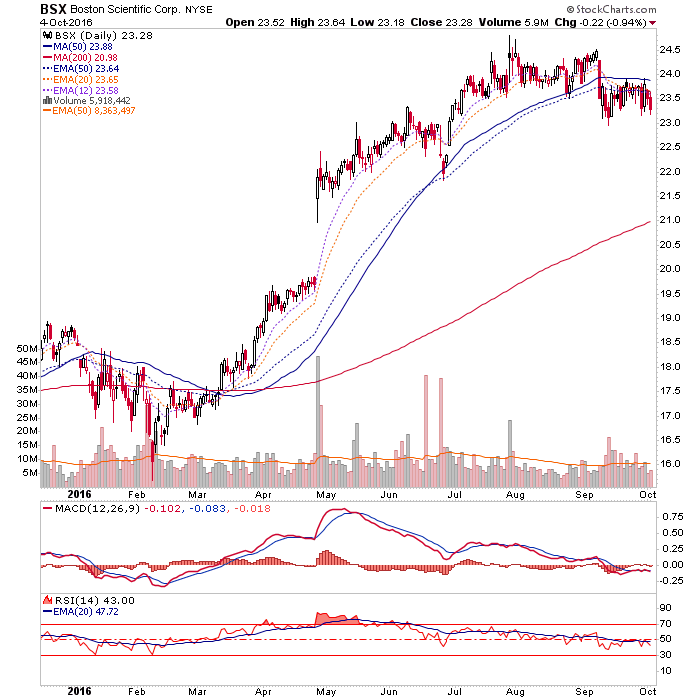
Do You Think This Is A Nice Chart?
Me neither. Boston Scientific (BSX) was a very successful NFTRH+ long idea nearly a year ago (w/ updates along the way). Today? Not so much (indeed, I gave it a shot on the short side). It reached and exceeded our original target of 23 and has since rolled over a bit and has been locked below the 50 day moving averages (EMA and SMA). It looks ugly as it stands now.
The S&P 500 is by the way, in a somewhat similar situation. We have been speculating that the rally of the last couple weeks is a bear flag. And that is what it is, as long as it remains below the 50 day averages. If it goes above then, voila, no bear flag! The key level to break the grip of a potential downside reaction scenario is and has been the Sept. 22 high. That was the post-FOMC euphoria day. We used it as a bear marker in the gold stock sector (the miners never even got close to it again before this week’s wipe out) and SPX remains conspicuously below this parameter as well.
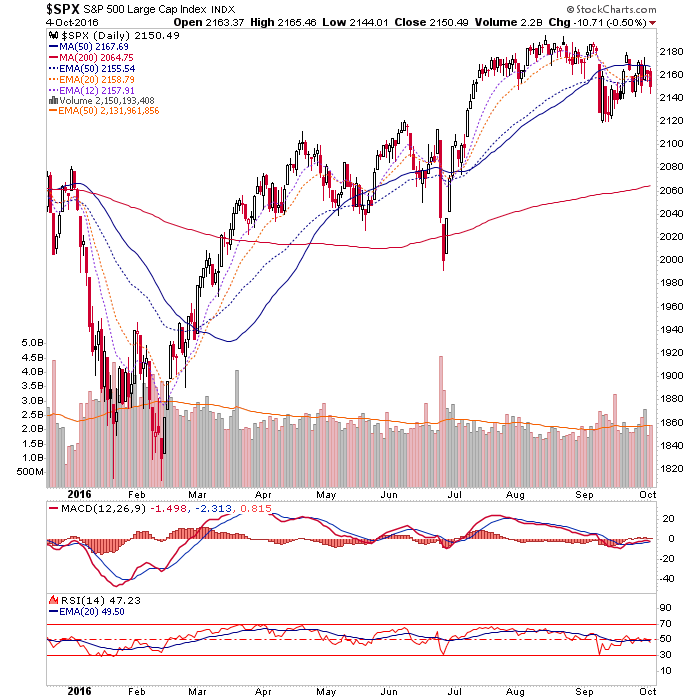
Now, since then the Semi sector has made new highs, Junk Bonds are just fine flying around way up there and we are getting some interesting indications on inflation. So we cannot discount the ever-obsessive Federal Reserve and what Jawboning or actions might come into play at any time the market shows chronic weakness. But taking the S&P 500 and several individual indexes and stocks (like BSX) into account, there remains a good chance that our favored scenario (a drop to 2100 +/- or even the SMA 200) is still in play, near-term. Later, I continue to bias bullish.
Disclosure: Subscribe to more


