
DJIA Driven By Fundamentals, Not White House Twitter
DJIA continues to move to equilibrium with value
U.S. Quantitative Contraction underway
Pushing up US$ and 30 Year T Bond Rates
However, Foreign inflows to keep Bonds and US$ stable
Gold and Base Metals are Buys
The dividend discount value of the DJIA is function of two vectors, the aggregate dividend of its constituents and the yield of the U.S. 30 year T Bond. Since September 1981, when the U.S. 30 year T Bond peaked at 15.20% following Mr Volker’s fight against inflation, the dividend of the DJIA has risen 8.57 times from $55,79 to $478.35 while the yield of the T Bond yield has fallen to 2.93% resulting in a 5.19 fold increase in the price of the 30 year T bond.
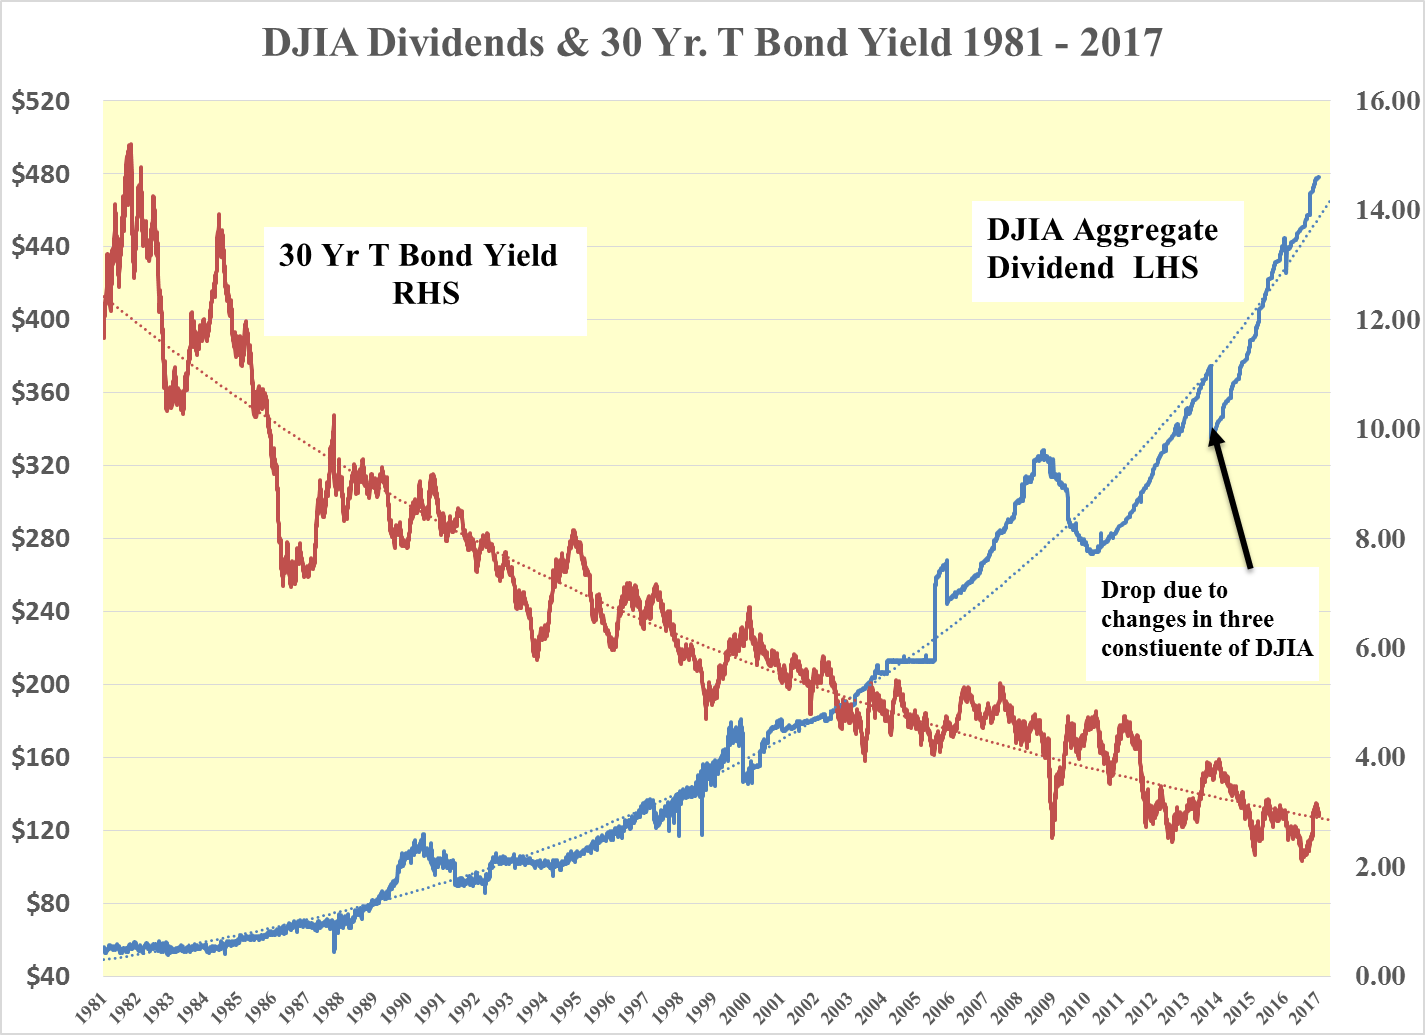
Multiplying the 5.19 times increase in the bond market with the 8.57 fold rise in the dividend, the dividend discount value of the DJIA has risen 44.48 times. Using the DJIA price from the same day as the 30 year T bond peaked at 15.2% the DJIA value has moved from 848 in 1981 to 37,700. The price of the DJIA, however, stands at a 47% discount from its value.

This is the same model that I have been refining since the summer of 1987. The price and value had a correlation coefficient up until Lehman of 0.93 and for the entire period since 1981 of 0.87. As such the model has been extremely useful in pointing to where the price of the DJIA should be. Today the value at 37,700 points to put upward pressure on the price of the DJIA, as it has been since Lehman and hence there is every reason to continue to BUY the DJIA.
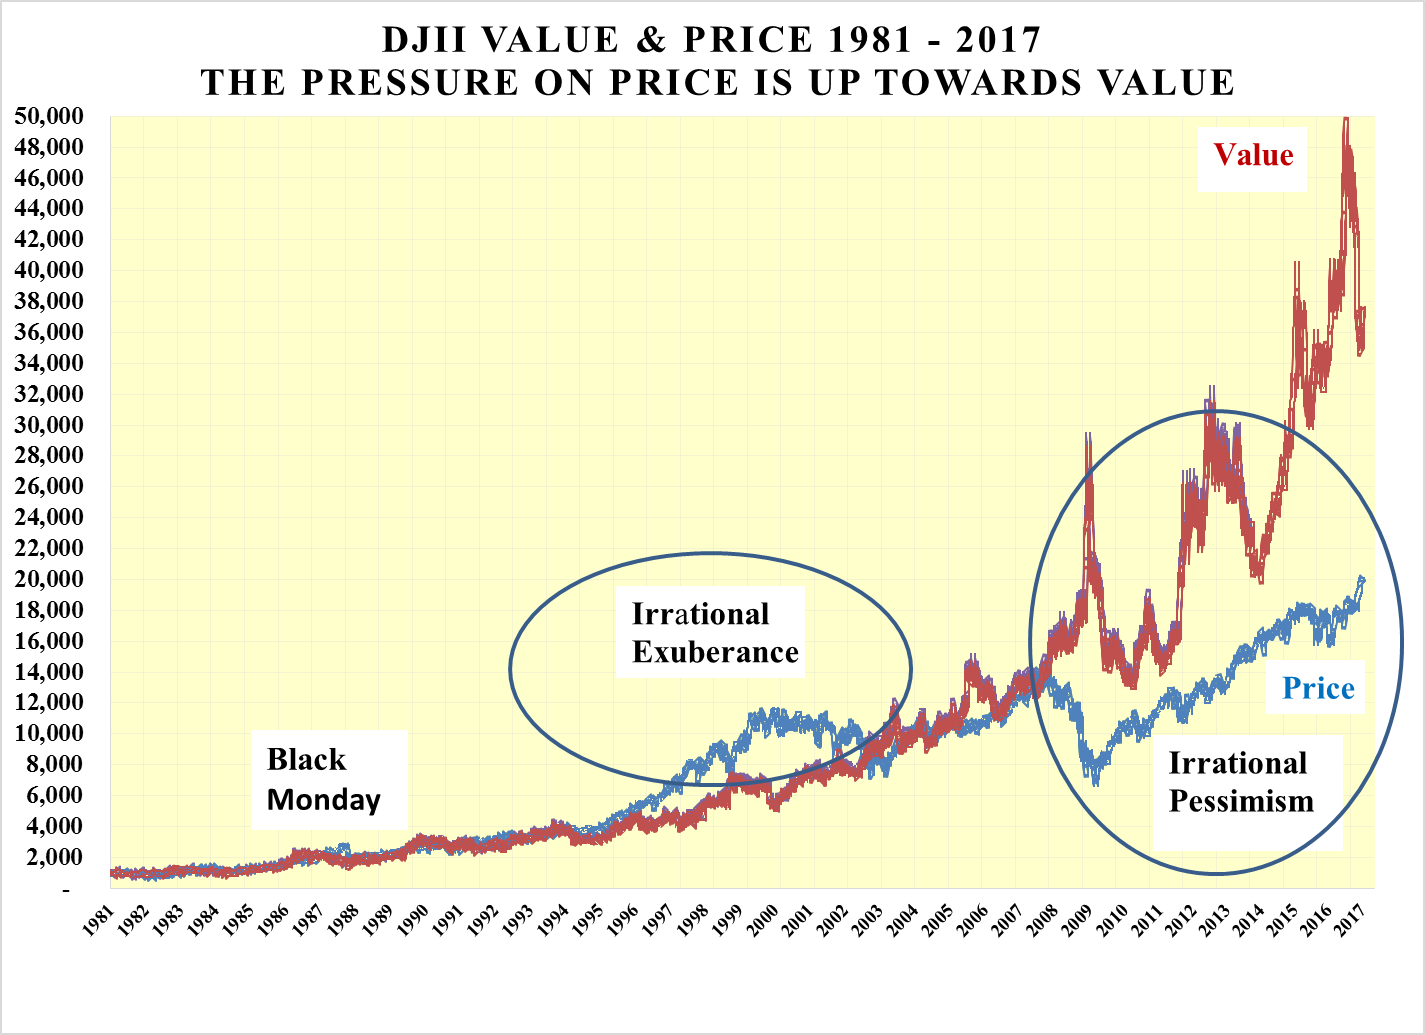
Many market observers contend that the recent strength of the DJIA is attributable to the electoral success of Donald Trump and that this will soon give way to reality with the DJIA falling. However, the fundamentals of the value of the DJIA being so far above its price have been in place for so long prior to the electoral cycle that regardless of who was elected, the DJIA would have risen just by removing the uncertainty of who is to be the next president.
The following chart shows the ratio of 30 year T Bond to the DJIA yield. This demonstrates in a more magnified manner the same argument as above. Many commentators argue that the market is overpriced today and that we are facing a repeat of 1987, 1994 and 1999-2000 when irrational exuberance ruled the roost and the dot.bomb era brought the roaring 90s to an end.
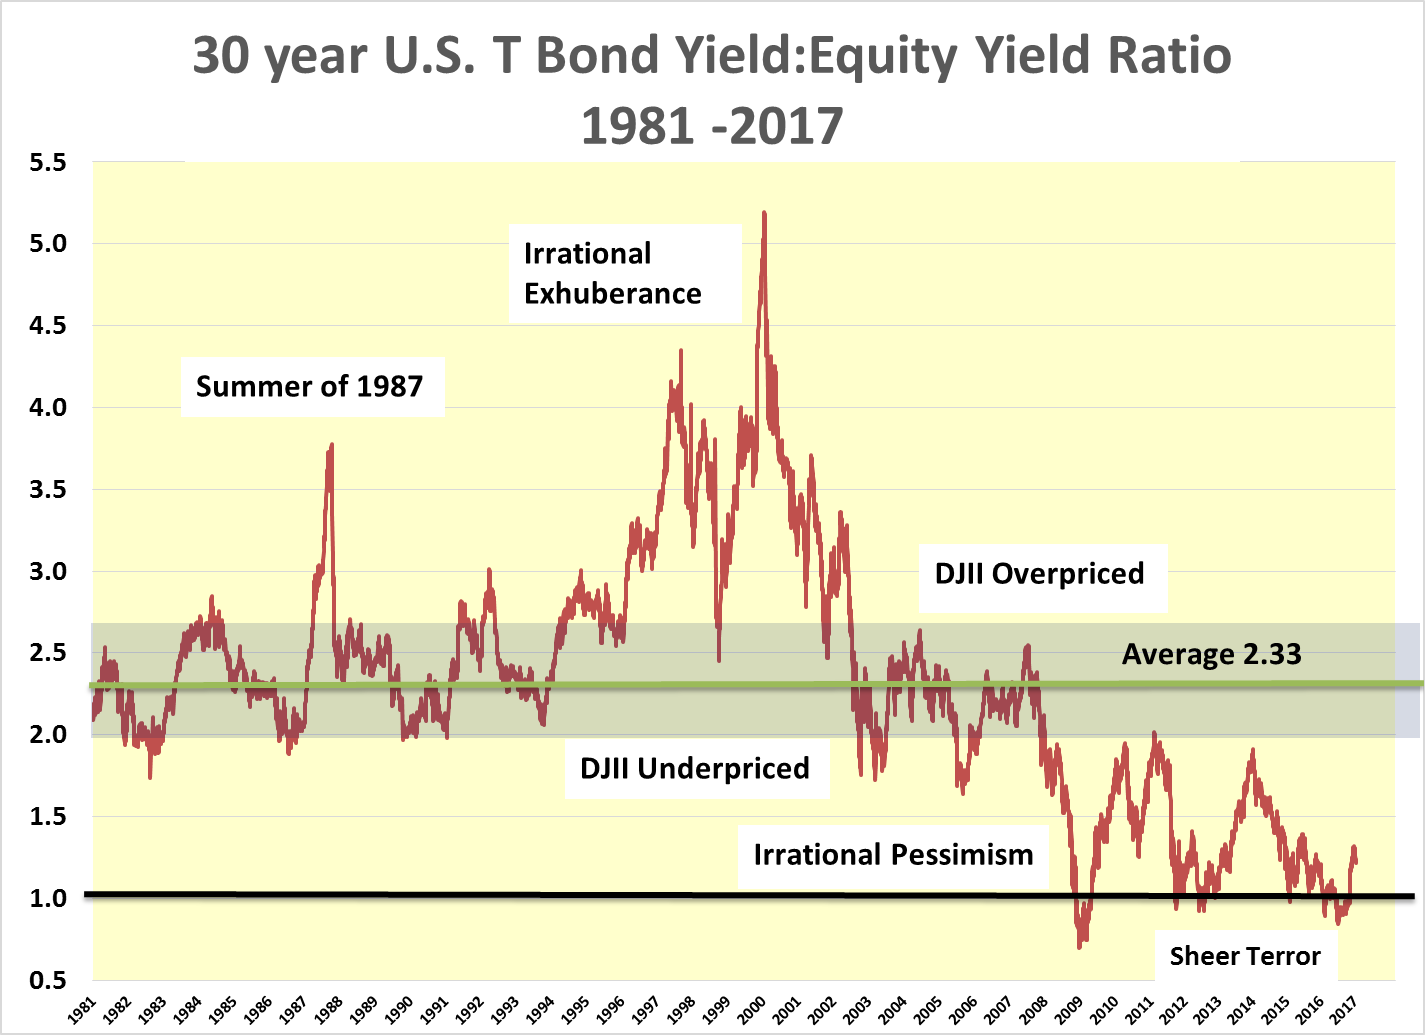
Looking at 1987 it can be seen that the problem was not “Black Monday” but the sunmmer of 1987 when after a rise in the 30 year T Bond in the spring of that year the dividend discount value of the DJIA fell away, yet the price of the DJIA continued to rise only to be brought back to fair value on Black Monday when the world was offered one of the great buying opportunities of the twentieth century.
The Crash of 1987 - Cartoon style
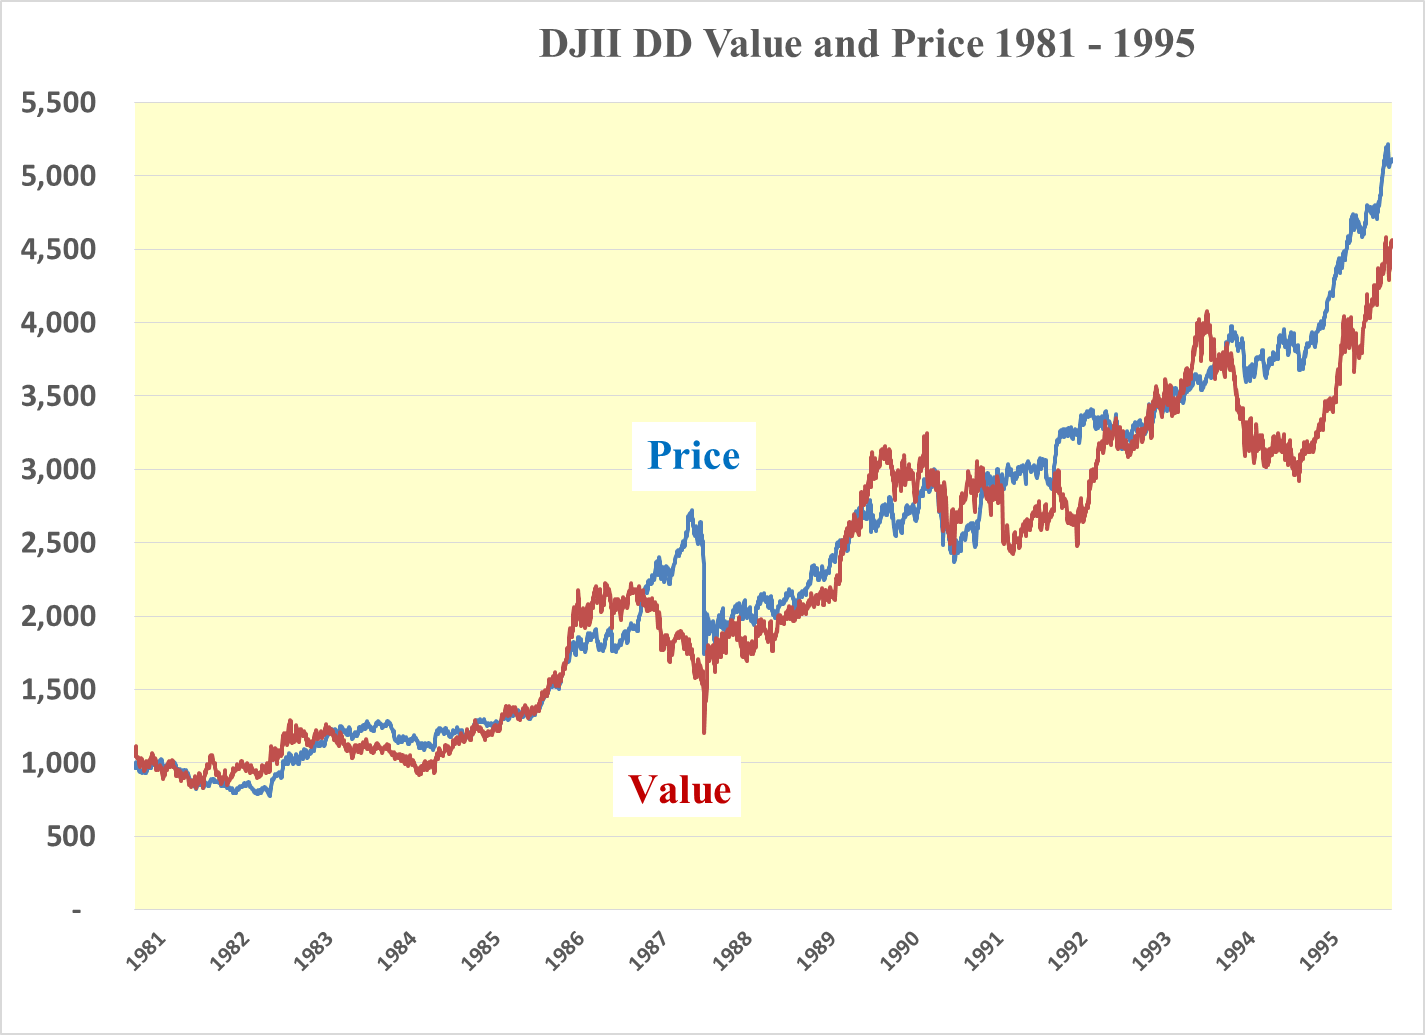
The crash of 1987 can best be visualized as a scene from the Looney Tunes and Merrie Melodies series of cartoons about Road Runner and Wile E. Coyote.

Driven by falling interest rates in the first part of 1986, Road Runner charged up the red value hill in the chart below. Wile E Coyote chased Road Runner up the blue price glide path. As interest rates started to rise from the 7.25% low of 1986 to the 10.25% high of 1987, Road Runner become cautious and followed the red value line down.
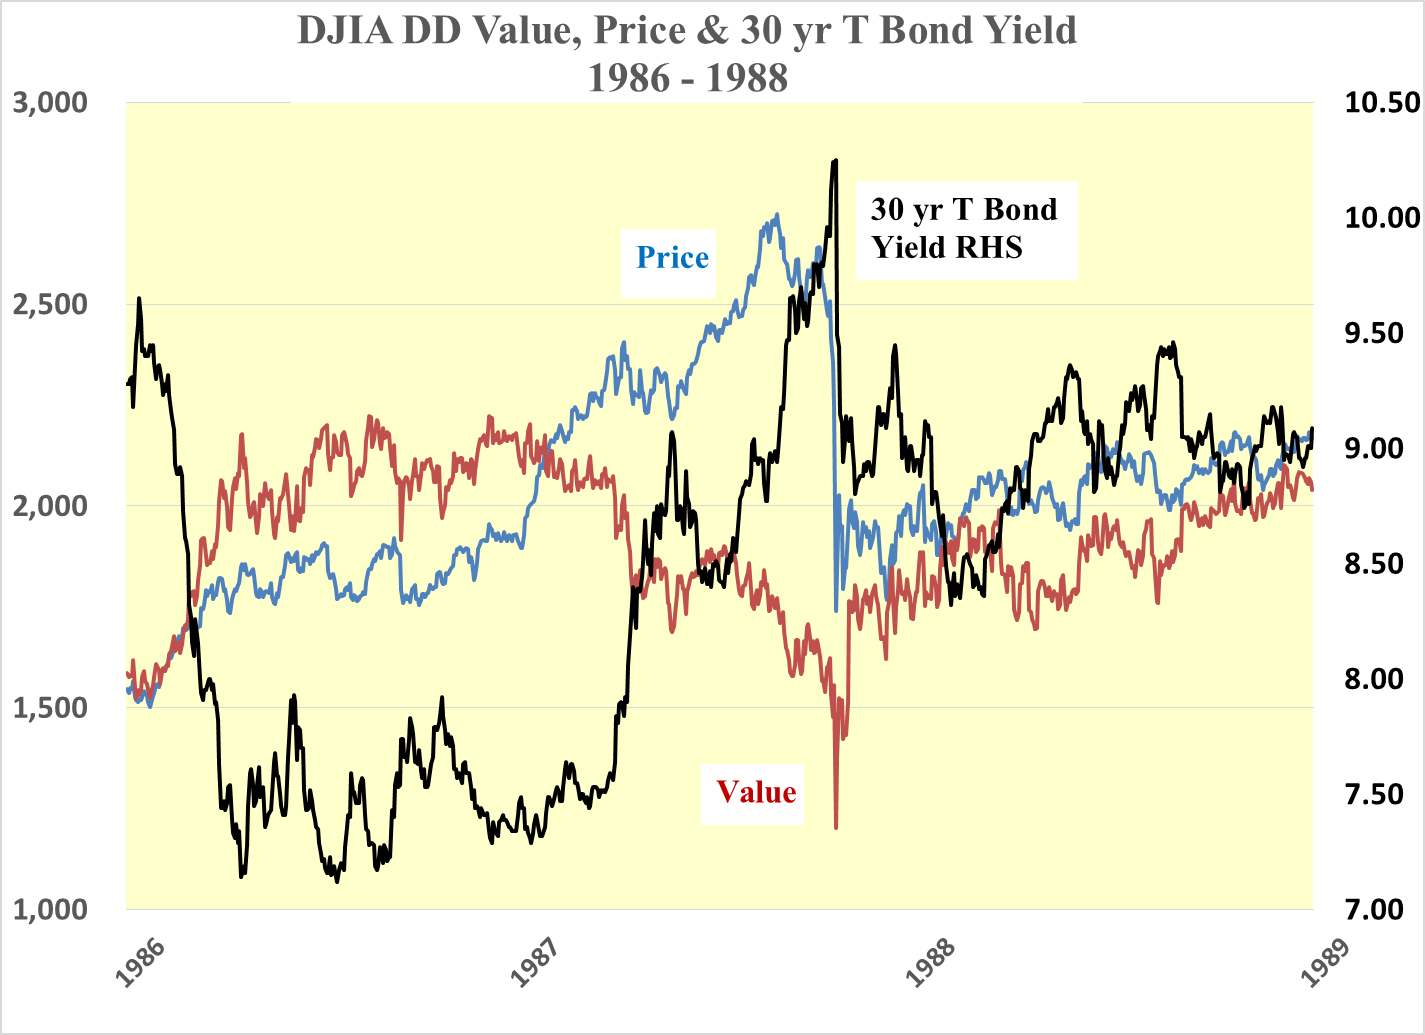
Like the majority of market participants, who have an amazing propensity for projecting the most recent trend ad infinitum, Wile E Coyote charges upward with abandon into the wild blue yonder. Only then did he realize that he was running on thin air. The inevitable happened on Black Monday.
The bailout for both the DJIA and Wile E. Coyote was the quick action by Fed and a broad flight to safety with the consequent sharp reduction of the 30 year T Bond Yield.
The 1994 Back-up of 30 Year T Bond Yield
While far from being as either dramatic or traumatic as 1987, a similar rise in the yield of the 30 year T Bond took place in 1994. From a low of 5.75% in 1993 to 8.25% in 1994. Unlike 1987 the price of the DJIA stagnated through the election year until rates fell following the reelection of President Clinton. After which time both the value and price started to race upward again like Road Runner and Wile E Coyote even though Wile E. Coyote was sprinting ahead of Road Runner as irrational exuberance started to dominate the DJIA.
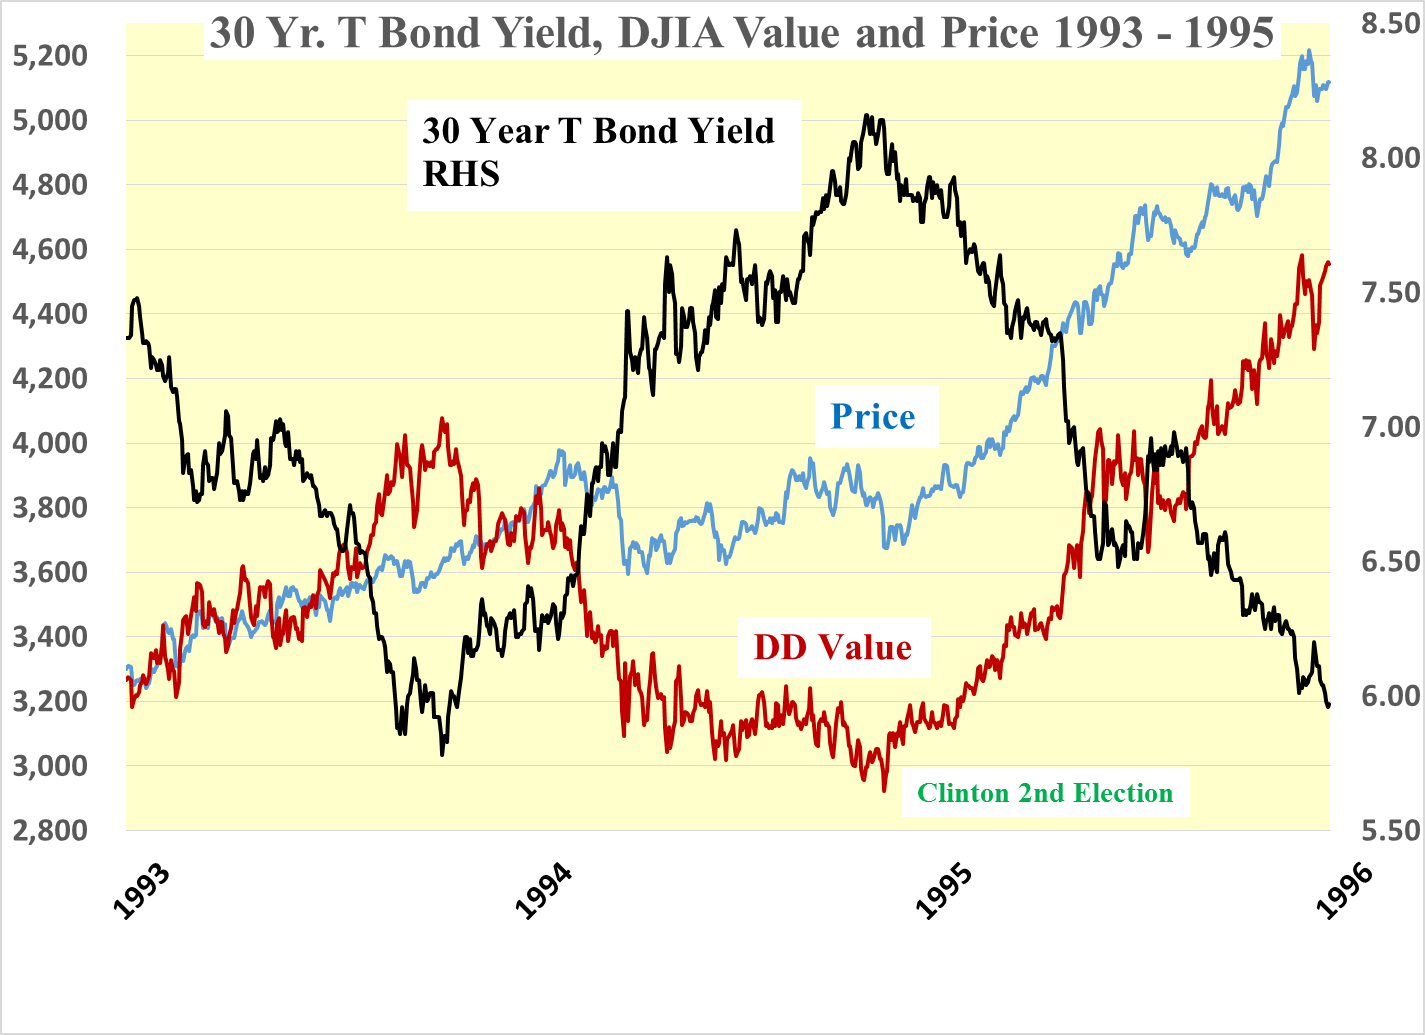
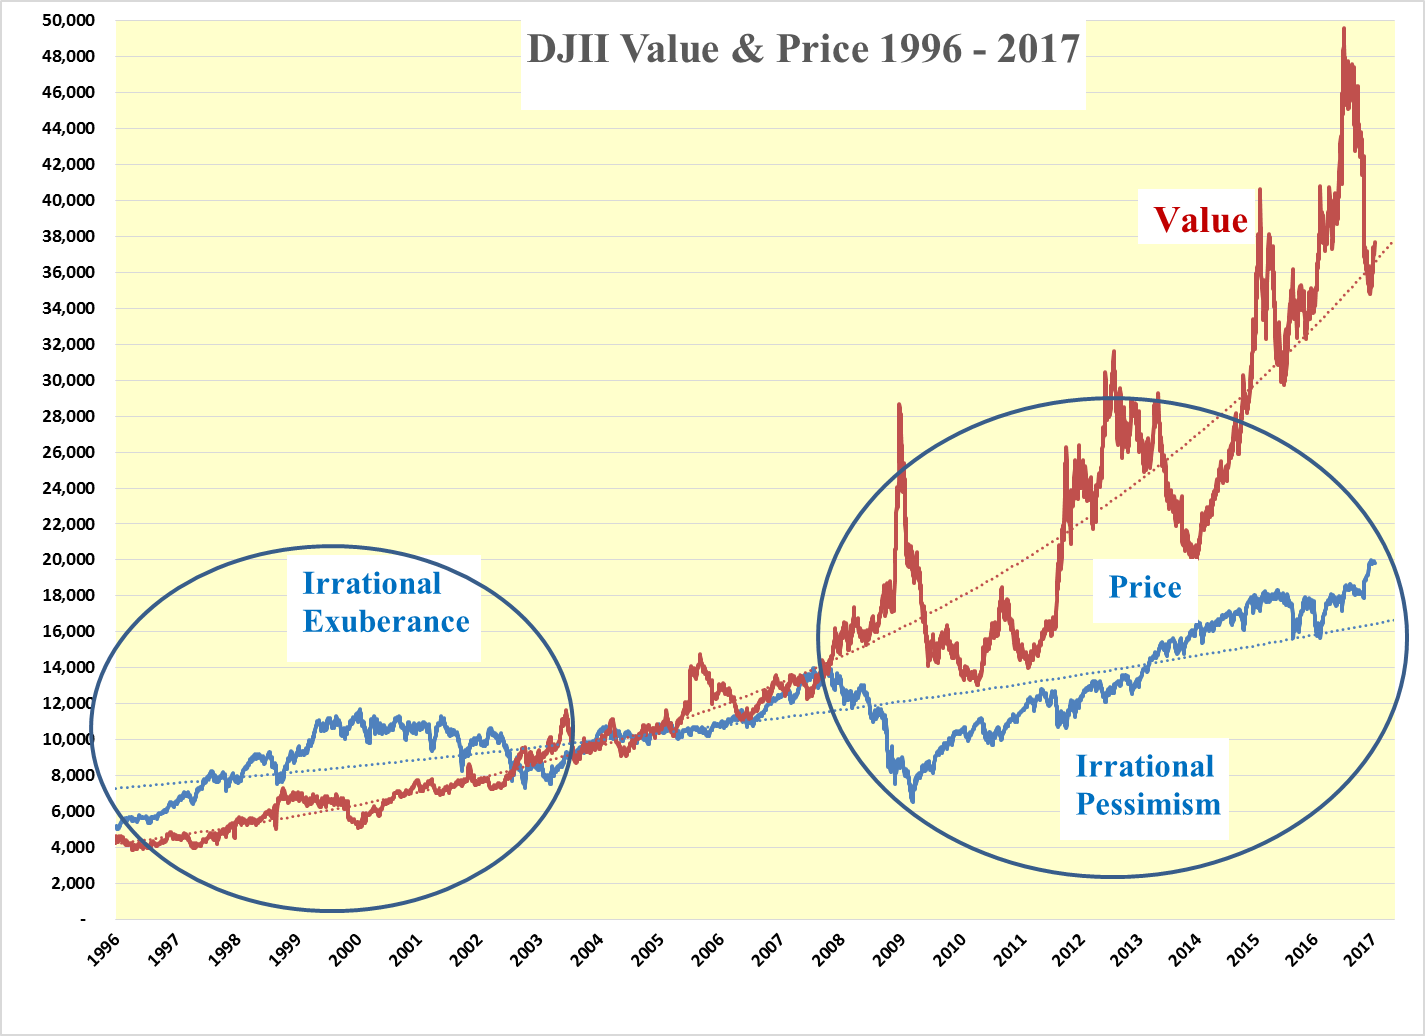
Irrational exuberance continued until the era of dot.bombs in early 2000 when sanity returned to equity markets and Road Runner advanced with rising dividends and steady interest rates. In 2007 DJIA earnings began to fall and then tank in 2008, threatening dividends as the sub-prime mortgage scam began to unwind and hugely over-leveraged financial institutions crashed.
This time around Wile E. Coyote stayed clear of Road Runner which reacted to collapsing interest rates by charging upwards. Remaining cautious until now Wile E. Coyote has stayed far below Road Runner despite there being a very low risk of a 1987 drop from thin air.
The DJIA dividend is at a record level and with earnings turning up the dividend is considered safe with the payout ratio being at only 51%. This leaves the outlook for the other vector in the dividend discount value, namely the yield of the 30 year T bond yield. Should this continue to rise as it has since last July then the dividend discount value will fall unless dividends continue to rise. For an insight into the possibility of the 30 year T bond yield rising we must turn to what is happening to the U.S. monetary base.
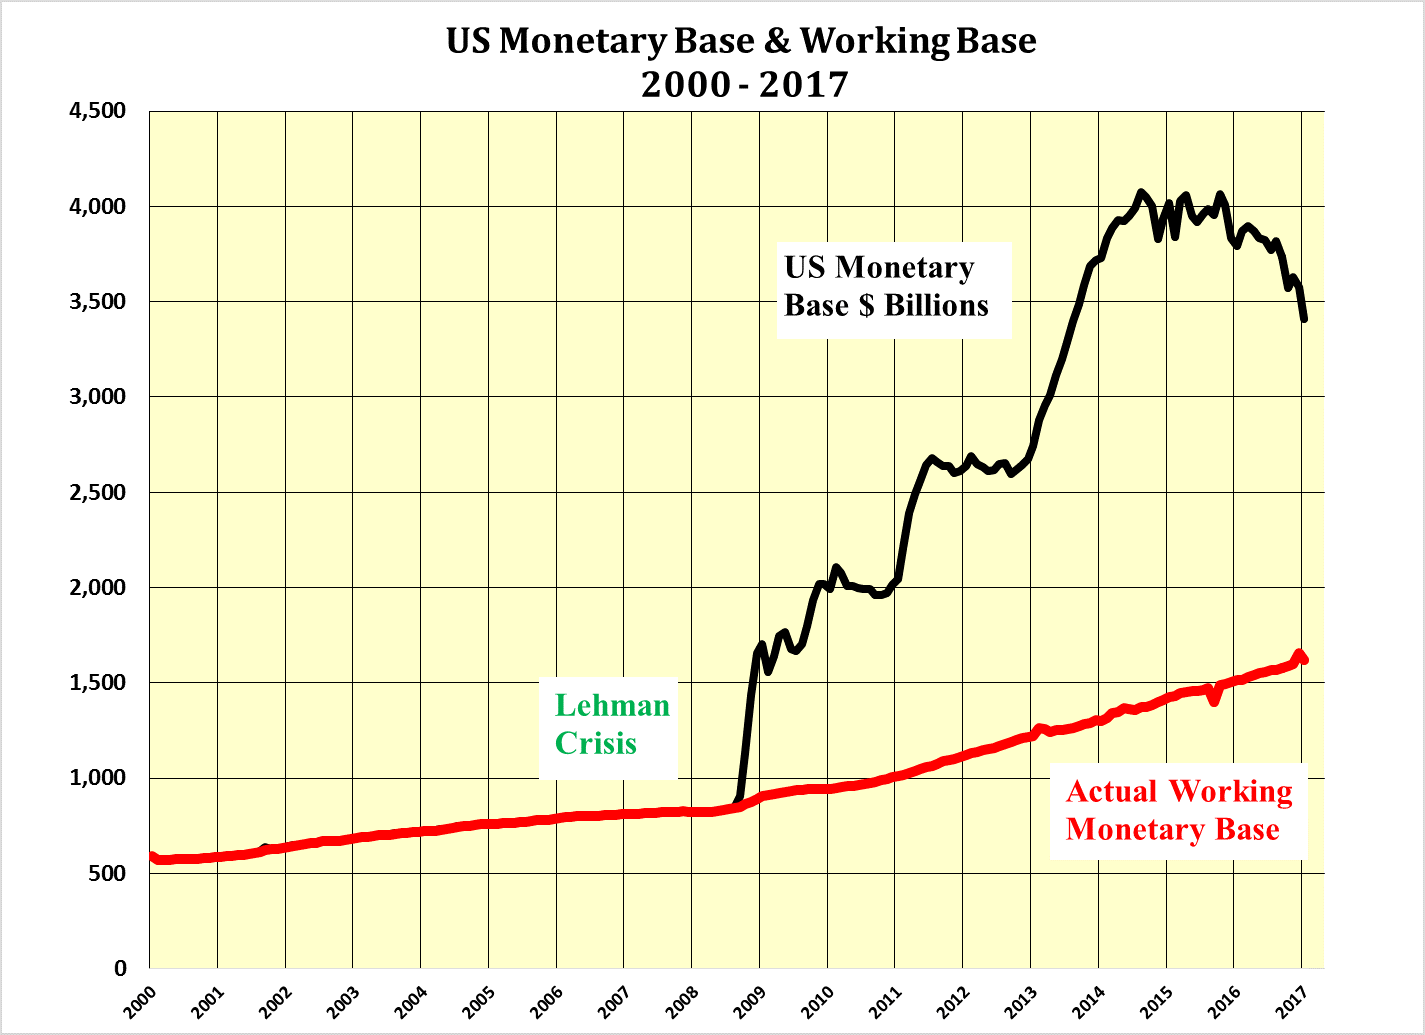
The decline of the U.S. Monetary Base Continues
As U.S. Quantitative Contraction continues It should be no surprise that the U.S. dollar strength continues relative to the currencies of other countries, which are still either in quantitative easing mode or are not contracting their respective monetary bases.
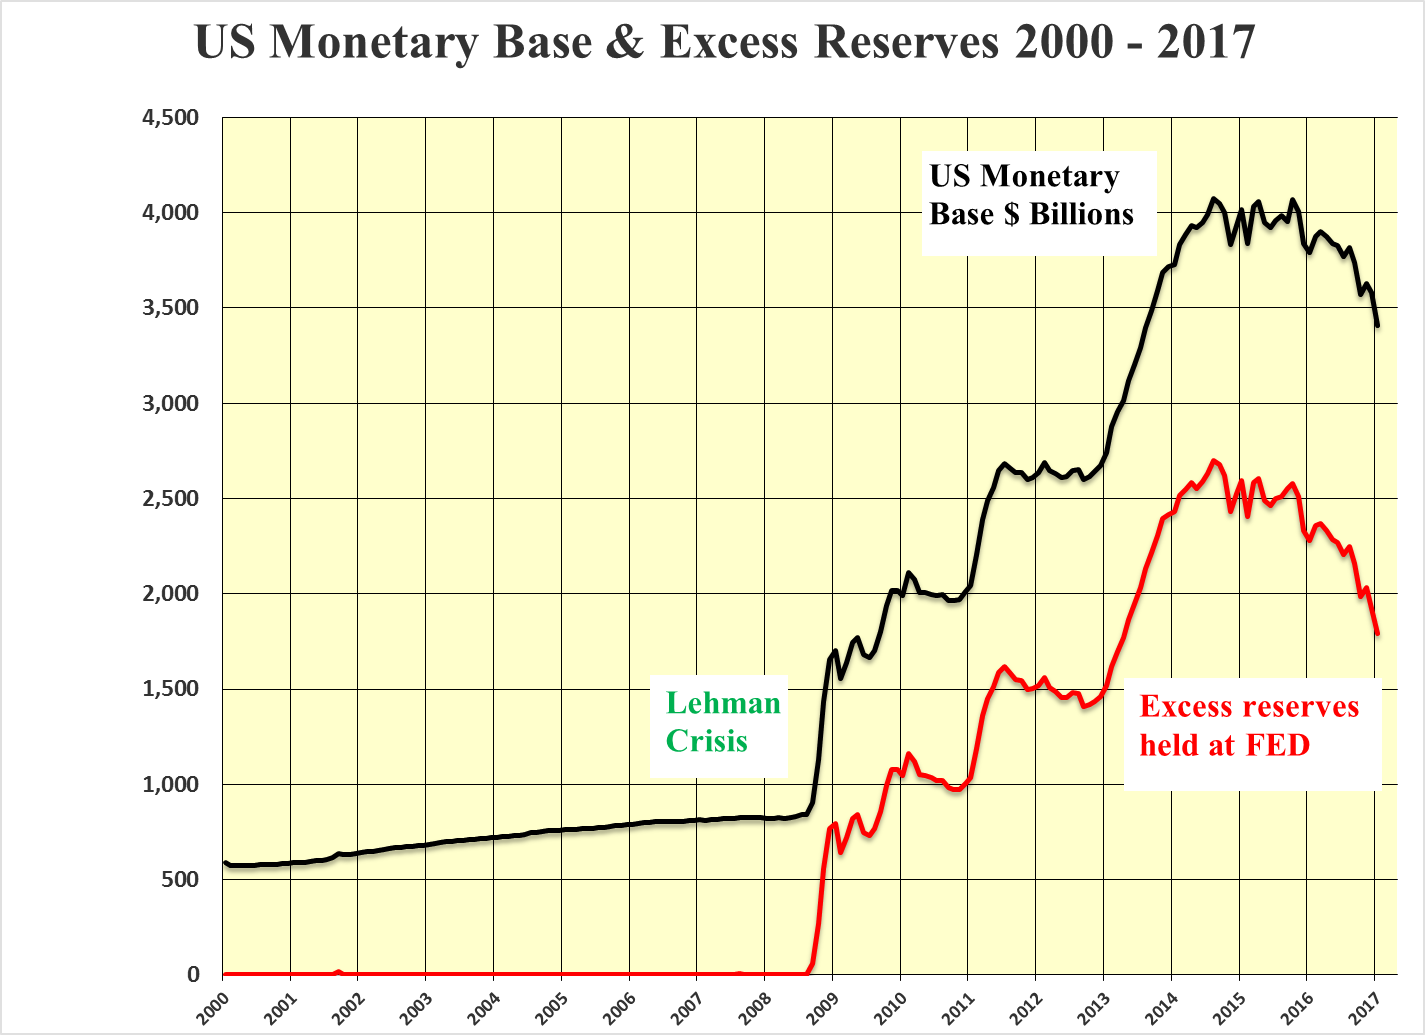
In the space of two and a half years since the summer of 2014, the total U.S. monetary base has fallen by 16% from $4.1 trillion to $3.4 trillion. To put the drop of $0.7 trillion into perspective the total monetary base before Lehman was only $0.8 trillion and it had taken 232 years to reach that level.
The excess reserves held at the Fed have fallen by an even greater amount of $0.9 trillion or 34% from $2.7 trillion to $1.8 trillion as the Fed continues to play monetary didgeridoo, sucking and blowing simultaneously.
The net result of this digerification is that despite the decline in the total U.S. monetary base, which is pushing up the relative price of the U.S. dollar, the Actual Working Monetary Base is still rising as excess reserves continue to flow into the real economy, which is finally showing signs of acceleration.
The continuation of quantitative easing outside the United States should temper the rise in U.S. domestic interest rates including that of the US 30 year T bond. Foreign funds flow in search of safety and higher sovereign yields have been attracted to the rising U.S. dollar as well as the rise in the 30 year T Bond to the 3% level from its low point of 2.1% on July 8, 2016.
In an article entitled “Buying Bonds and Selling Equities: Abject Madness” that was published on June 14, 2016 it was argued that selling the DJIA at 16,675 and yielding 2.54% to buy 30 year T Bonds yielding only 2.42% made no sense whatsoever. The trade should have been the other way around.
http://www.tonyhayesblog.com/home/buying-bonds-and-selling-equities-abject-madness
With little or no prospect of a US recession in the short to medium term, the contraction of the monetary base is unlikely to be soon reversed. This points to continuing strength of the U.S. dollar. However, the inflow of foreign capital should hold interest rates down. Thus holding back any runaway U.S. dollar strength in 2017 while economic recovery overseas should ultimately lead to the ending of foreign QE.
The combination of QC and the influx of foreign funds into the United States should hold the 30 year T bond within 10 to 15 bps of the 3% level. Together with further increases in the DJIA dividends means the continuation of the upward pressure on the DJIA price which has been the case for the past eight years.
Just because the 30 year T Bond yield has finished falling and the 36 year bull market in bonds is over it does not automatically mean that rates must now return to the 15.2% of 1981. They could go sideways for quite a while. Furthermore, even if that argument is brushed aside it may take another 36 years to get back to the 1981 level. In the meantime dividends will probably also have risen, offsetting much, if not all of, the impact on value from the rise in the yield of the 30 year T bond.
Gold – Anticipated pull back is over. Time to Buy
On October 6, 2016 in an article entitled “Fed Playing Didgeridoo with U.S. Monetary Base” It was argued that the price of gold should track the rise in the AWMB but the anticipated strength of the U.S. dollar “it seems certain that there will be weakness in the gold price in the short term”
Gold fell in the interim from $1,260 per oz. on October 6, 2016 to $1,126 per oz. on December 15, 2016 and has rebounded to $1,216 today as the U.S. dollar has pulled back from the December highs in line with lower 30 year T Bond yield.
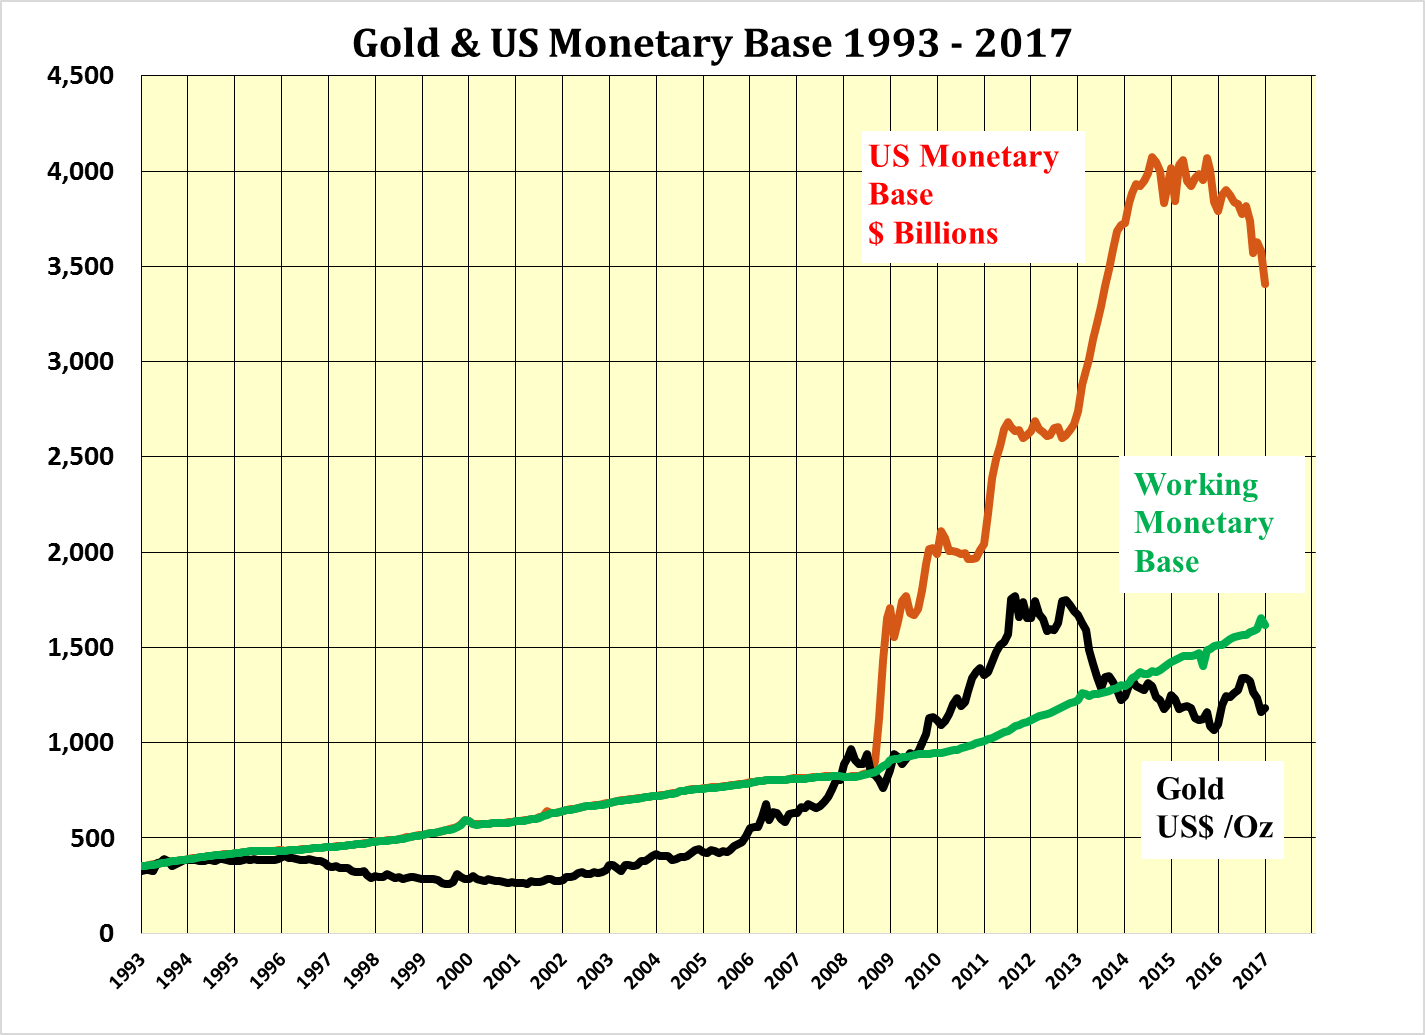
So where goes gold from here? With longer term interest rates being held in check by inflows of foreign funds the U.S. dollar should hold steady around parity. Under such conditions the price of gold should track back to the level of the AWMB as 2017 progresses. At over $1600 per oz. this should result in excellent profits for the gold producers and favour the smaller and intermediate producers such as Endeavour Mining Corp EDV –TMX Semafo Inc. SMF - TMX and Kirkland Lake Gold Ltd KL – TMX.

By the time $1,600 is reached the gold funds should be enjoying significant inflows and the managers will be seeking bought deals to satisfy their needs to be fully invested. This should also be accompanied by good performance by the exploration and development companies.
Base Metals - Now is the time to act
Having past their respective nadirs as expected in the latter part of 2015 and the first part of 2016 the base metals and the producers should now start to benefit from improving economic conditions over the next couple of years. In particular copper and zinc.
One intermediate copper producer that springs to mind is Imperial Metals Corp III – TMX, should perform well with a rising copper price as its new Red Chris mine was brought on stream during the copper bear market. As an indication of the level of investor interest in the shares, Imperial closed an oversubscribed private placement at $5.50per share for Can. $65 million on December 30, 2016.
more


How can I learn more about this (the basics)?
You should start with a book by the master of value investing Ben Graham and see how you go,
www.chapters.indigo.ca/.../9780060555665-item.html
I am sure that it is available elsewhere, The paper back edition is available for $20,
Kind regards
Tony
Thanks for sharing