
Dissecting The Crash In Crude Oil That Brought A Sudden Bear Market
That escalated quickly. While energy markets were moving higher under potential supply shocks, a domino of events in global macro markets shifted the conversation to too much supply relative to possibly shrinking demand.
Commodities are one of the pure supply and demand markets left, and when the shifts in the balances of demand or supply arise, sharp price moves often result.
This fundamental walkthrough of Crude’s breakdown will walk through four lenses of viewing the breakdown that may show a v-bottom may be difficult to actualize despite RSI(14) being the most oversold since 2014.
WE'LL TAKE A FUNDAMENTAL LOOK AT CRUDE'S BEAR MARKET THROUGH FOUR LENSES:
- Emerging Markets via the EEM ETF
- Institutional Positioning
- Futures Spreads Shift from Backwardation to Contango
- US Crude Stockpiles showing rising supply on falling demand
WE'LL TAKE A FUNDAMENTAL LOOK AT CRUDE'S BEAR MARKET THROUGH FOUR LENSES:
Data Source: Bloomberg
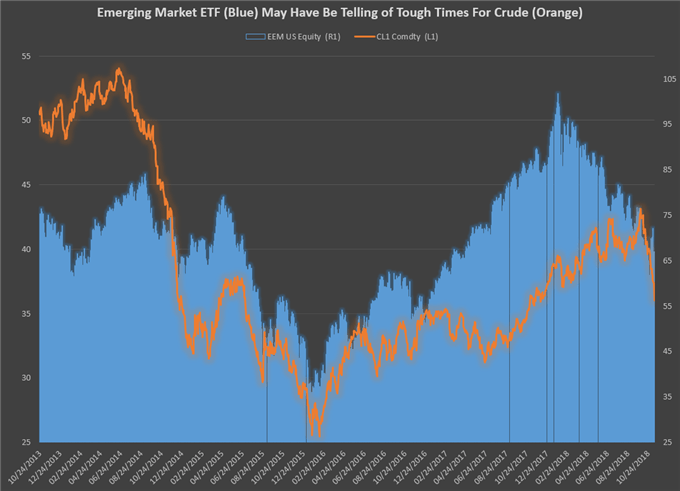
The chart above shows the toping process that happened early in the year on EEM. EEM has fallen ~24% on the back of trade wars concerns and limited demand from China and other formerly strong emerging markets. Much of this drop has accelerated as the US Dollar has strengthened on the back of the Federal Reserve’s persistent hike of interest rates with views building that 3-4 hikes could be coming in the next year.
For energy demand, emerging markets are a near necessity as their demand tends to convert less from services and consumption as in developed markets and into real estate development and industrial demand. Therefore, the sharp drop in EEM over 2018 has also eaten into the perceived demand for crude.
INSTITUTIONAL POSITIONING SHOWS AGGRESSIVE BIAS LOWER
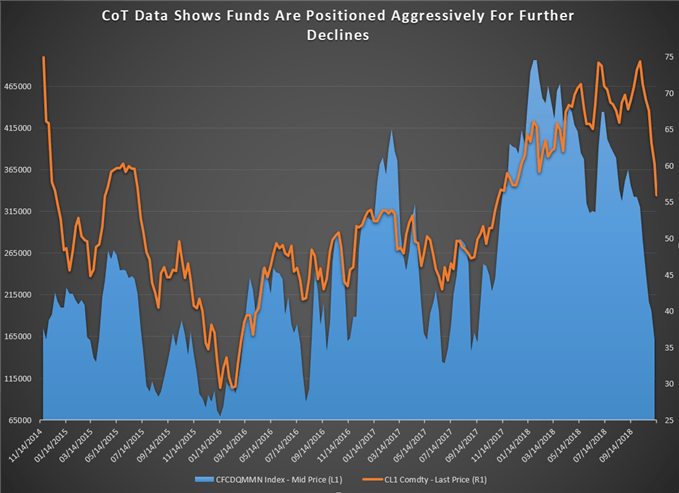
Data source: CFTC, Bloomberg
Money managers have fallen out of love with crude. The chart above shows the net positions, which has fallen steadily over the year gave the move higher in crude through early October was standing on hollow legs.
The positioning data above fails to show the extreme dearth of long-only hedge fund positions, which stands at the lowest levels since 2014as if the 14-month low in net-positions was not bad enough. In other words, from an institutional positioning point of view, the buyers have left the building.
US CRUDE OIL STOCKPILES ARE GROWING SHOWING FALLING DEMAND
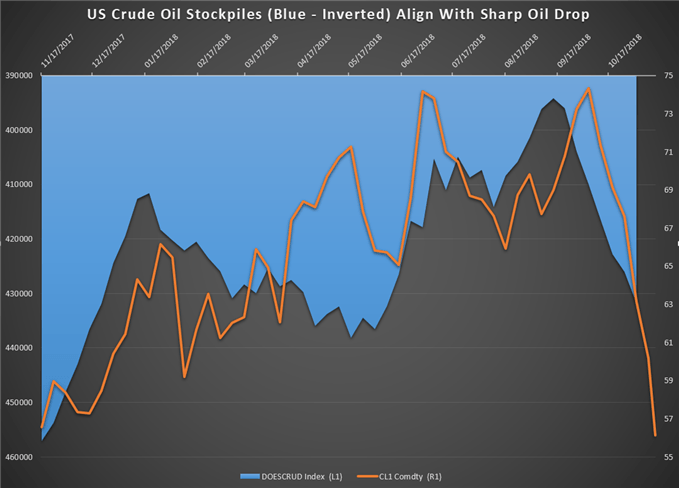
Data source: DoE, Bloomberg
Over the last few years, the market has ridden on the news of production curbs from OPEC and strategic alliances. At the start of the week, there was a seeming bounce that was soon erased when news from newly planned production cuts from OPEC may resurface that could last through 2019.
However, this production curb strategy mainly works if we’re only dealing with an oversupply issue and not a problem with demand as well. The chart above shows an inverted view of US stockpiles in blue with crude oilin orange. Since the chart is inverted, the blue line falling is showing a growth in stockpiles that communicates a drop in demand.
Since mid-September supplies have been steadily building, which also shows the divergence of the last really in early October.
INSIGHT FROM THE FUTURES CURVE – BYE-BYE FRONT MONTH PREMIUM
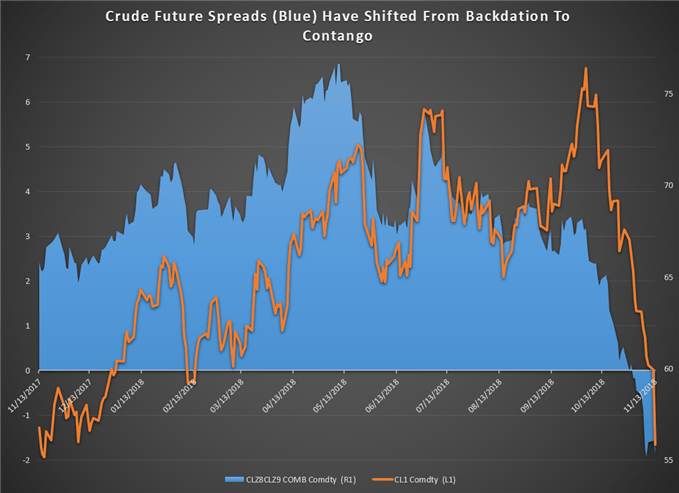
Data Source: Bloomberg
The futures curve is a tool that speculators and hedgers or corporates alike look to as the perceived fair value of an asset at different points in time due to the available information. The back of the curve is often a helpful source of information about sentiment and perceived effects of current policies.
The December 2019 contract that makes up the back of the curve has fallen aggressively, but less so than the front month of December 2018. The chart above shows a spread between the December 2018 WTI crude contracts minus the December 2019 WTI crude contract. A positive number shows a front-monthpremium, and favors an upward bias in the futures market as the benefits to hold crude exceed the cost to hold. This is no longer the case.
You’ll notice a sharp drop in the spread to negative $1.85 to the lowest level since mid-2016 when Crude was trading in the lower $40s.
Disclosure: Do you want to see how retail traders are currently trading the US Dollar? Check out our IG Client Sentiment ...
more

