
Did Today’s Market Bounce Negate Yesterday’s Breakdown?
Yesterday, I wrote a piece called “The #MAGA Stock Market Trendline Is Broken” in which I showed how the U.S. stock market’s sharp decline caused several major stock indices to break below their important uptrend lines that have formed in early-2016. I described this breakdown as a “very important change of trend”. I also explained that this breakdown was very concerning to me as someone who is warning about a dangerous stock market bubble (please watch my presentation to learn more). Today, the Dow rose 399.95 points and the S&P 500 rose 49.46 points, causing many traders to become excited that a big rebound is ahead. Unfortunately, today’s market bounce did not negate yesterday’s bearish technical developments.
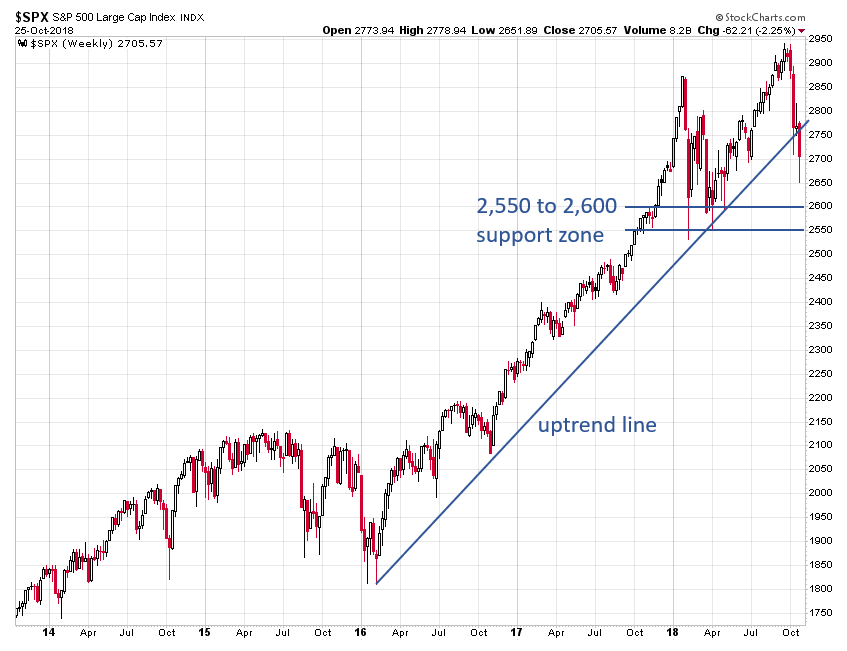
Wednesday’s sell-off caused the S&P 500 to break below its uptrend line that began in early-2016. Today’s bounce did nothing to negate yesterday’s bearish breakdown because the index is still below its uptrend line, which is now a resistance level. For further confirmation, I want to see if the S&P 500 stays beneath this level by the close of trading on Friday. The next major technical support and price target to watch is the 2,550 to 2,600 support zone that formed at the lows earlier this year.
(Click on image to enlarge)
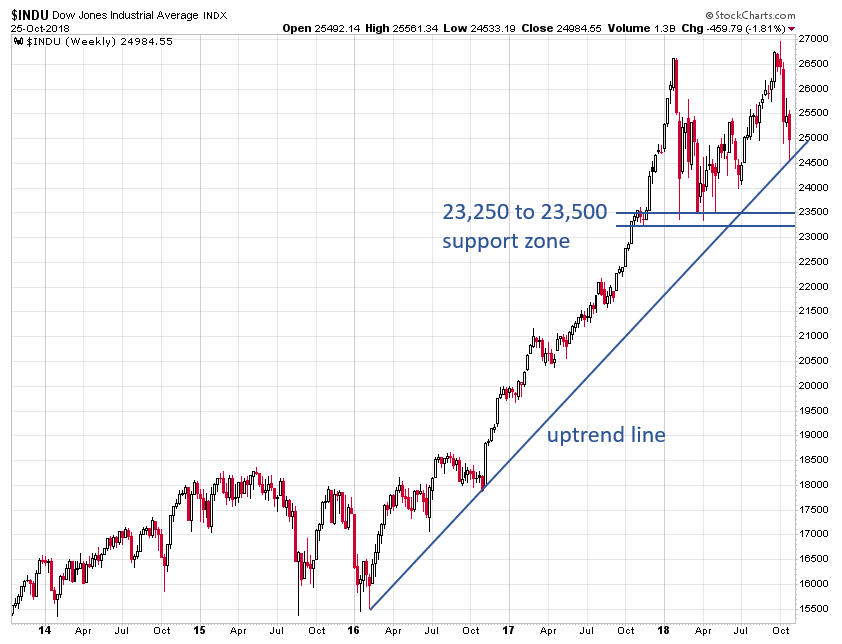
Unlike the S&P 500, the Dow Jones Industrial Average has not yet broken below its key uptrend line. On Wednesday, the Dow briefly touched its uptrend line, but rebounded off of it on Thursday. If the Dow closes below this uptrend line in a convincing manner on the weekly chart (possibly in the next couple days if the sell-off resumes), the next important support level and price target to watch is the 23,250 to 23,500 zone that formed in early-2018.
(Click on image to enlarge)
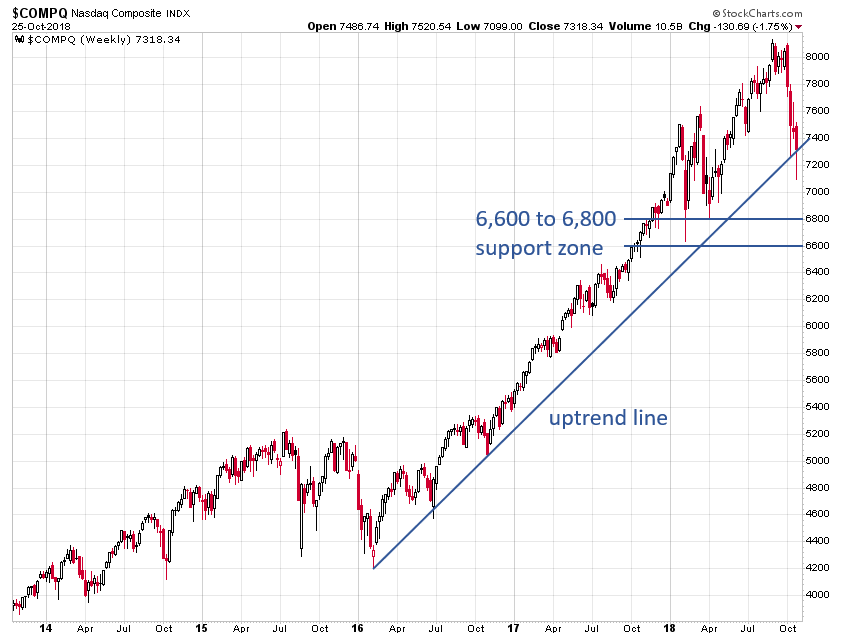
The Nasdaq Composite index broke below its key trendline for the first time on Wednesday, but today’s rebound caused the index to close almost exactly at this key level. Amazon and Alphabet‘s earnings misses have caused a sell-off in after-hours that is not reflected in the chart below but will be reflected in Friday’s chart. If the Nasdaq closes 1 to 2 percent lower on Friday, it will close below this uptrend line on the weekly chart, which would give a bearish confirmation signal. The next price target to watch is the 6,600 to 6,800 support zone that formed earlier this year.
(Click on image to enlarge)
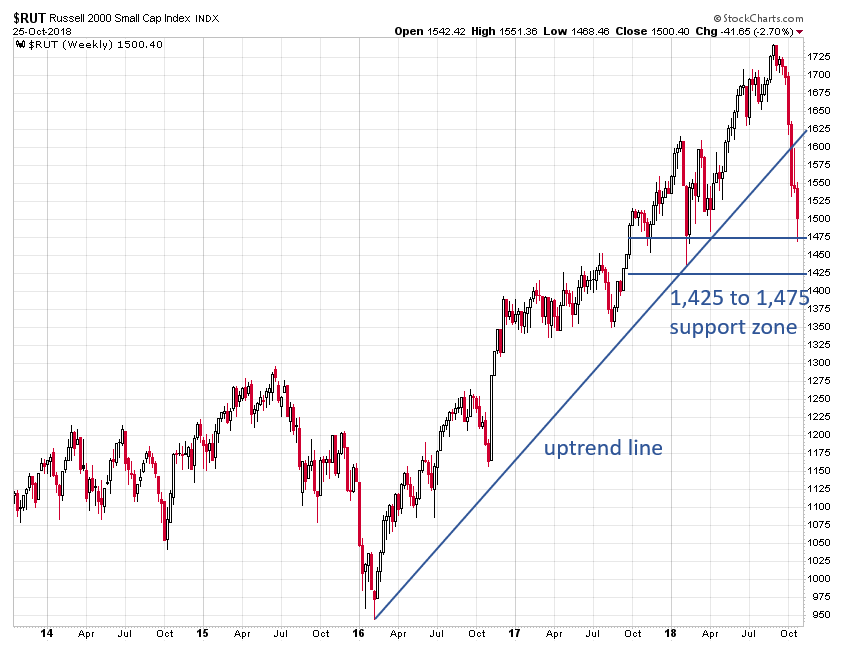
The small-cap Russell 2000 index broke below its uptrend line two weeks ago and tested the 1,475 support level on Wednesday. If the index breaks below the 1,425 to 1,475 support zone, it would give yet another bearish signal.
(Click on image to enlarge)
Today’s market bounce does not change my views or make me any less concerned than I was yesterday. After sharp bearish moves like we experienced yesterday, it is normal to have a brief technical bounce. It’s important to keep in mind that these types of bounces are typically just noise, not signal. I caution against reading too deeply into them. If the bounce doesn’t negate the recent trendline breakdowns, it means very little to me. Please stay tuned for tomorrow’s update.
For the author's full disclosure policy, click here.


