DHS: Bucking ‘18 Street Consensus
Ask the market what fate awaits stocks with high dividends, and the answer often lies in the outlook for interest rates. This is logical. When bond yields rise, the incentive to own stocks that offer higher dividends wanes, and vice versa. Fortunately for the WisdomTree U.S. High Dividend Fund (DHS), a rising rate environment hasn’t hit the market in recent years, right? Actually, wrong.
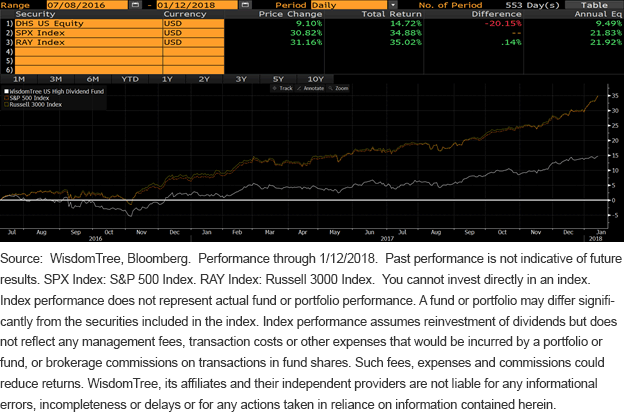
In the summer of 2016, U.S. 10-Year Treasury note yields collapsed to 1.359%, and they have subsequently risen more than a full point, to 2.55%.1 The pain in yield-oriented DHS has been palpable (figure 1).
Figure 1: Performance Since 2016 Low in 10-Year T-Note Yield
(Click on image to enlarge)

Click here for DHS standardized performance.
The thing is that right now there is a remarkably crowded Wall Street consensus that U.S. 10-Year T-note yields will continue to rise in 2018, so much so that predictions by 54 out of 61 economists compiled by Bloomberg in January see them going higher. In fact, not one economics team put a “1” as the first digit on the yield for the end of 2018. This is a crowded consensus.
If they are right, more trouble is probably in store for DHS compared to broad U.S. equity indexes. However, if they are proved wrong, which happens too often for comfort when the consensus is lopsided, we could be looking at a value play for the few who entered 2018 with a contrarian view on rates. And rates may not even have to move lower to aid DHS; it could be as simple as a situation in which rates do not move much higher, or that they chop sideways, disappointing the economists’ collective forecasts and surprising the masses.
The “Siegel Chart”: Put It Under the Pillow, Rip Van Winkle
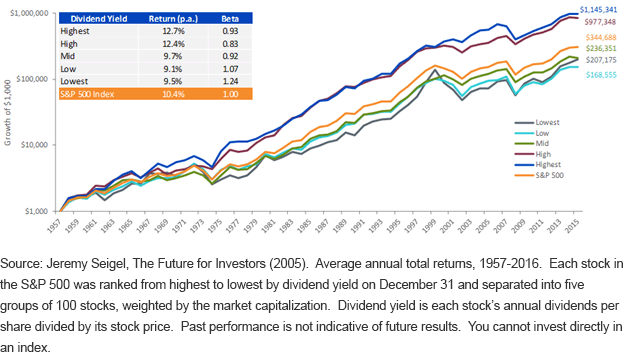
Outside of the macro case for yield-oriented securities to have a bout of relative performance in 2018, we have the supporting half century of fundamental data in the form of what WisdomTree affectionately refers to as “the Siegel chart.” After watching DHS underperform the S&P 500 by double-digit percentage points in 2017, the Siegel chart in figure 2 may provide solace for those who take greater comfort in six decades of data than in the action of just a few recent years.
That data shows that a strategy that divided the S&P 500 into five groups of 100 based on each company’s dividend yield, with an annual rebalance, would have resulted in 230 basis points (bps) of annual outperformance for the highest-yielding group over 59 years. In retrospect, it would have been wise to enter a high-dividend strategy back in 1957 and take a multidecade Rip Van Winkle nap, waking to a very pleasant result today.
Figure 2: “The Siegel Chart”
(Click on image to enlarge)

Siegel + Consensus Bucking for 2018
What Professor Jeremy Siegel found, quite plainly and clearly—and what we have all heard, read and talked about for years—is that companies that send money back to shareholders are less likely to squander it on bad ideas and bad ventures.
Companies that pay dividends, and pay handsomely, are usually the ones that are serving their stockholders. With time, that consideration can pay off.
Because DHS screens for the 30% of companies in our dividend-paying universe that have the highest yields, these modern alpha ETFs reincarnate the Siegel study for those who realize that sometimes investing boils down to the use of logic and reason.
Tie in this modern alpha concept with the nearer-term crowding of Wall Street consensus and the result looks like a nice recipe for 2018.
Disclaimer: Investors should carefully consider the investment objectives, risks, charges and expenses of the Funds before investing. U.S. investors only: To obtain a prospectus containing this ...
more


