
Deep-Value ETF Report: End-Of-Year Review
US stock market volatility has soared in recent months, but the surge for this measure of risk hasn’t knocked American equities from their perch as the best performer for the major asset classes for the trailing five-year return, a proxy for estimating the state of value pricing. At the opposite extreme, broadly defined commodities continue to post the deepest shade of red ink for the major asset classes.
The choice of the five-year annualized return to rank funds from a value perspective is inspired by “Value and Momentum Everywhere,” a 2013 Journal of Finance paper by AQR Capital Management’s Cliff Asness and two co-authors. There’s a wide set of value metrics, but as an initial screen across asset classes and its subsets there’s a case for using a simple performance review. Why? It’s easy and facilitates the analysis across a broad range of assets on an apples-to-apples basis.
On that basis, let’s review the state of value pricing across a broad range of markets. The ranking below covers 135 exchange-traded products that run the gamut: US and foreign stocks, bonds, real estate, commodities and currencies. (You can find the full list here, sorted in descending order by annualized five-year return — based on 1260 trading days — through yesterday, Dec. 26). Note that the full playing field becomes quite granular in spots. In equities, for instance, the ETF list ranges from broad regional definitions (Asia, Latin America, etc,) to country funds, down to US sectors (energy, financials, for instance) and industries (e.g., oil & gas equipment & services). The only restriction is what’s available for US exchange-listed funds. Otherwise, the search is broad and deep, or at least as deep as permitted given the current lineup of ETFs.
Let’s begin with the major asset classes for a top-down review. Once again, broadly defined commodities continue to post the steepest five-year loss in this category: iPath Bloomberg Commodity (DJP) is under water by an annualized -10.3%. That’s far deeper vs. the next-steepest loss: VanEck Vectors JP Morgan Emerging Market Local Currency Bond (EMLC), which is down a relatively modest -1.9% on an annualized basis over the last five years.

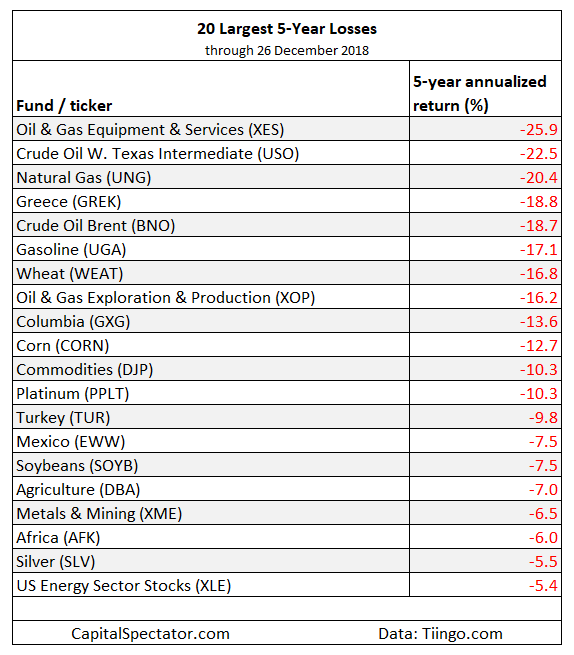
The next table shows the 20-deepest losses for the full list of funds. It’s dominated by commodities, peppered with equities in a handful of emerging markets, including VanEck Vectors Africa (AFK), which has lost an annualized -6.0% over the past five years. For various reasons, the crowd is heavily discounting the future for equity markets across the African continent. As such, AFK offers one of the stronger value plays in the international equity space.
Disclosure: None.


