
Decelerating Trade Growth Between China And U.S.
What effect is the tit-for-tat trading of tariffs between the U.S. and China having upon the world's two largest trading partners economies?
Based on the U.S. Census Bureau's data for the value of goods and services traded between the two nations and adjusting for the exchange rate between the U.S. dollar and Chinese yuan, we're seeing the kind of deceleration that is consistent with economic slowdowns taking hold in both economies. The following chart shows the year-over-year growth rate of the value of goods exported between the U.S. and China from January 1986 through May 2018.

The key takeaway from this chart is the negative year over year growth rate of U.S. exports to China and the single-digit growth rate of Chinese exports to the U.S., which has continued for the second month. This continued negative trend represents the largest negative adjustment outside of the seasonal impact of the variable timing of China's week-long Spring Festival Golden Week holiday in the year-over-year data, which was responsible for the negative growth rates recorded for U.S. exports to China earlier in 2018.
The deceleration is evident in the trailing twelve month average of the combined value of trade between the two nations. The following chart shows the entire series for this data from January 1985 through May 2018, where the trailing twelve month average of the data smooths out the seasonal cycles and events that affect the year-over-year data.

Let's next zoom in on the period covered by the dashed red box in the upper right-hand corner of this chart, which covers the last decade.
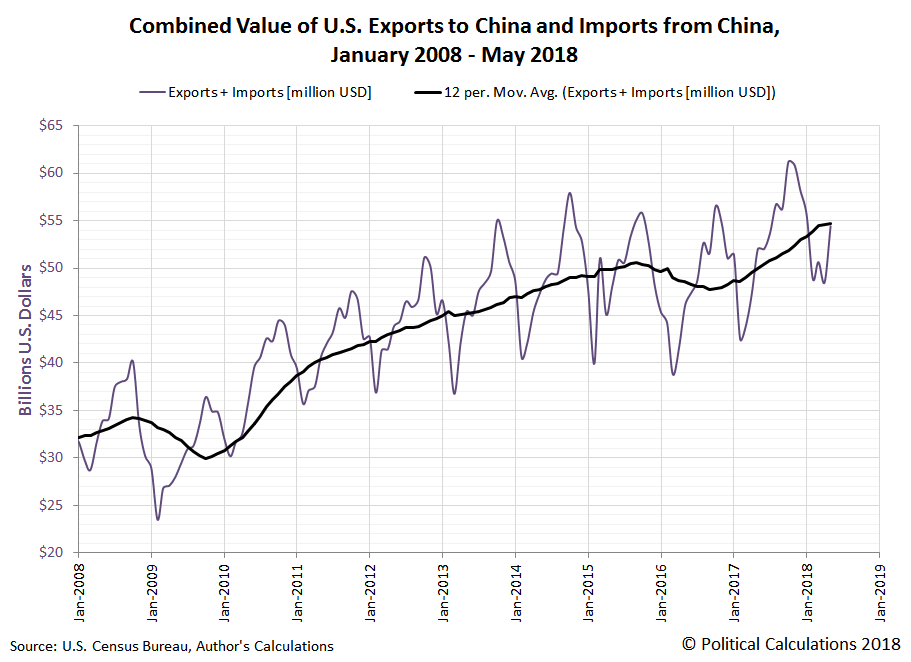
Here, we can see the deceleration as a downward shift in what had been a robust upward trajectory for the trailing year average of the total value of goods and services traded between the U.S. and China. While not yet negative, the deceleration taking place now is similar to the patterns that were observed back in October 2008, as the U.S. economy was reaching the most negative growth period of the Great Recession, and also in August 2015, when the negative impact of China's political leadership's 2013 decision to slow down the growth of China's economy began to be evident in the international trade data with the U.S.
The trade data over the next two months will be interesting to watch, where June 2018's data will capture the effort of businesses in both nations to "beat the clock" before each nation's more extensive proposed tariffs would go into effect, and where July 2018's data will capture a large portion of what happened after they did.
References
Board of Governors of the Federal Reserve System. China / U.S. Foreign Exchange Rate. G.5 Foreign Exchange Rates. Accessed 9 July 2018.
U.S. Census Bureau. Trade in Goods with China. Accessed 9 July 2018.
Disclaimer: Materials that are published by Political Calculations can provide visitors with free information and insights regarding the incentives created by the laws and policies described. ...
more

