
Data Tick In November TIC
November was the month where global bonds, particularly sovereign bonds, were routed in synchronized liquidation. As such, we would expect to find among various data sources evidence to suggest a monetary “dollar” background consistent with that fact. What that has meant in the months (and last several years) leading up to it was the foreign official sector in overdrive “selling UST’s” to try and fill in an enlarging “dollar” gap. That attempt had been moderately successful in the middle part of 2016, but outwardly much less so as summer turned autumn. The updated TIC figures for November, however, are not uniform as to that possibility.
The blended estimates say that for the first time in a year and a half the official sector actually, on net, bought US dollar assets. Specifically with regard to UST’s, the net decline in reported custody balances was only $936 million in November, as compared to about $45 billion in net sales each of the three months leading up to it.
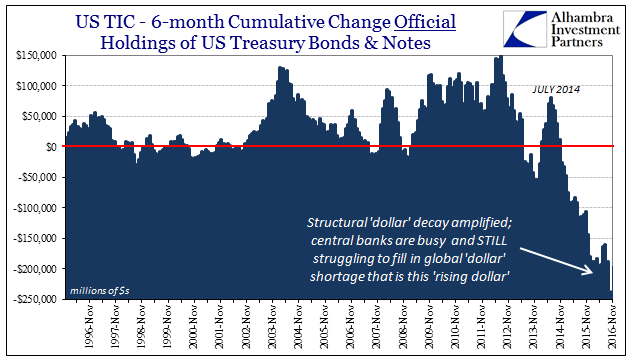

There seems to be, for some unknown reason, a quirk of Novembers in this part of the data series. Going back even further than what is pictured above, the estimates for the month of November always seem to be odd, as if inflicted with intentionally reduced volatility. In 2006, for example, official sector additions of US dollar assets were $25 billion that October and $24 billion that December, but only $6 billion for November 2006. Therefore it is difficult to place emphasis on these figures for lack of confidence in their possible accuracy.
Those questions are raised by the breakdown by specific countries. In this separate TIC source, the Treasury Department reports a net change in official UST holdings of about -$70 billion, which would be far more consistent with both past history as well as the events of November. Leading the way, as always, were the Chinese.
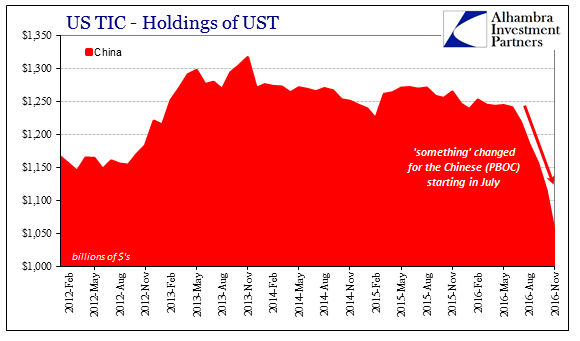
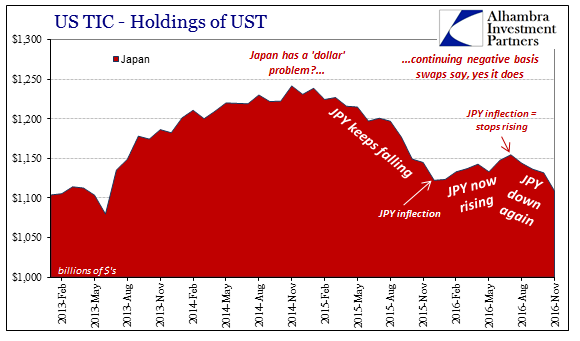
China’s reported holdings fell by $66 billion in that single month alone, an obvious escalation from -$41 billion in October and -$28 billion in September that matches both Chinese data as well as the behaviors of the PBOC and the Chinese currency. It wasn’t only China, however, as Japan reported a sizable $23 billion net decrease, the largest for that Asian country (demonstrating once more the Asia-centric flavor of this “rising dollar”) since October 2015 just prior to JPY’s appreciable appreciation.
These estimates are more in keeping with the same pattern of “dollar” activity particularly related to possible (but very likely) official sector interventions. The figures for bank liabilities are similarly consistent, though in being so raise other questions. The quarterly pattern of private bank estimates that had been very stable, meaning massive “dollar” retreat in the last month of each quarter, has been somewhat disrupted in both of the last two.
In October 2016, the first month of Q4, the net gain was only $53.9 billion, the second straight quarter where the first month’s retracement was conspicuously reduced. For November 2016, banks added an additional $11 billion as compared to what has been for the past few years typically another negative month in each quarter, but combined the first two months of Q4 are slightly less than the first two months of Q3, which was already considerably less than what has been normal going back to 2013 (emphasizing caution about what might be considered normal).


That is, again, consistent with the by-country breakdown of the official sector figures; the private sector provision of “dollars” is seriously weak so as to induce an outsized official sector response that in its ad hoc, bureaucratic nature is nowhere near sufficient or stable to prevent global disruption in whatever form (government bond rout this time).


Over the last six months, bank liabilities have declined cumulatively by the most since 2010, which would be one more corroborative data point given monetary conditions throughout much of the world (including LIBOR) but particularly Asia (including Hong Kong, dollars not just RMB).
If the inconsistent blended figure turns out to be correct, then it might still offer a plausible explanation as to what was observed in November suggesting that central banks and the foreign official sector pulled back from “selling UST’s”, thus “providing dollars”, leaving the global markets to trigger violent margin and collateral calls (repo fails) in the form of actual selling in UST’s (and gilts, bunds, etc.). Given the rest of the data, however, I doubt that was the case. Instead, it seems much more likely in my view that November was the same as past months only that much more amplified in its disruption-triggered official response.

With so much reversing in mid-December, it will be very interesting to see how the TIC data resolves and distills that possible inflection in “reflation” in these “dollar” terms (especially how banks ended Q4 given the major negative volatility in x-curr basis swaps).
Disclosure:
This material has been distributed fo or informational purposes only. It is the opinion of the author and should not be considered as investment advice or a recommendation ...
more

