
Crude Oil Prices Stand At Attention As Saudi, Russia Leaders Meet
Crude oil prices shot higher after EIA inventory flow data showed US stockpiles shed 4.14 million barrels last week. That topped forecasts calling for a more modest 1.09 million barrel outflow and an API projection signaling a slight build.
Gold prices prose despite a clear hawkish shift in forward guidance from the Federal Reserve. The metal initially fell as the US Dollar rallied, but an about-face reversal soon followed as pre-positioning for the ECB rate decision pushed the bellwether EUR/USD exchange rate upward.
Comments from ECB officials ahead of today’s meeting – particularly those from chief economist Peter Praet – suggested a substantive discussion of the strategy on QE asset purchases would be had. The markets seemed to interpret that to mean that they will soon be phased out.
OIL EYES SAUDI, RUSSIAN LEADERS’ MEETING
From here, soundbites from a meeting between Saudi Crown Prince Mohammed bin Salman and Russian President Vladimir Putin are in focus. They will discuss joint plans to push for scaling back the OPEC+ output cut scheme on the sidelines of a World Cup match between their countries’ teams.
The two leaders want to boost output to offset delivery disruptions from Iran and Venezuela, which the IEA has said could derail as much as 30 percent of supply. They face opposition from other top producers however, which might make for a contentious meeting when OPEC+ officials gather in Vienna next week.
DOVISH ECB MIGHT ECHO AS GOLD WEAKNESS
As for gold, the knock-on effects of the ECB policy call might remain the driving catalyst. Mario Draghi and company may sink EUR/USD if slowing growth and the disinflationary effects of a stronger Euro inspire a delay in stimulus withdrawal. Follow-on US Dollar strength might weigh on the yellow metal.
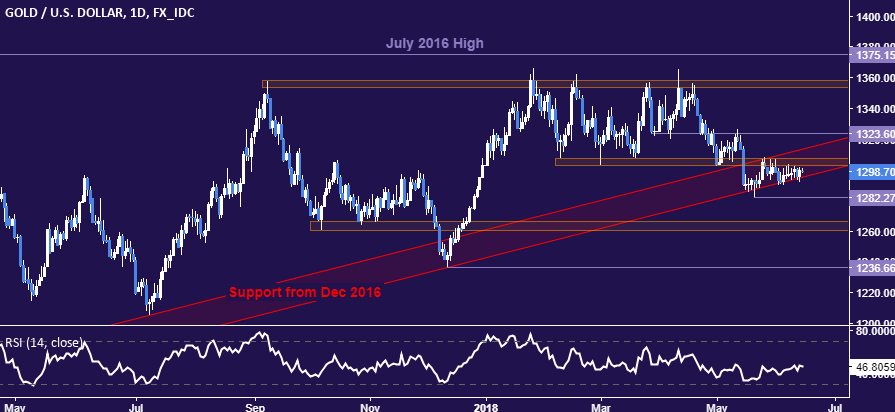
GOLD TECHNICAL ANALYSIS
Gold prices remain stuck at support guiding them higher since December 2016. Its lower bound is now at 1295.45, with a break below that initially exposing the May 21 low at 1282.27. Alternatively, a move above the 1302.97-07.32 area the upper bound of trend support (1313.28), followed by an inflection point at 1323.60.
(Click on image to enlarge)
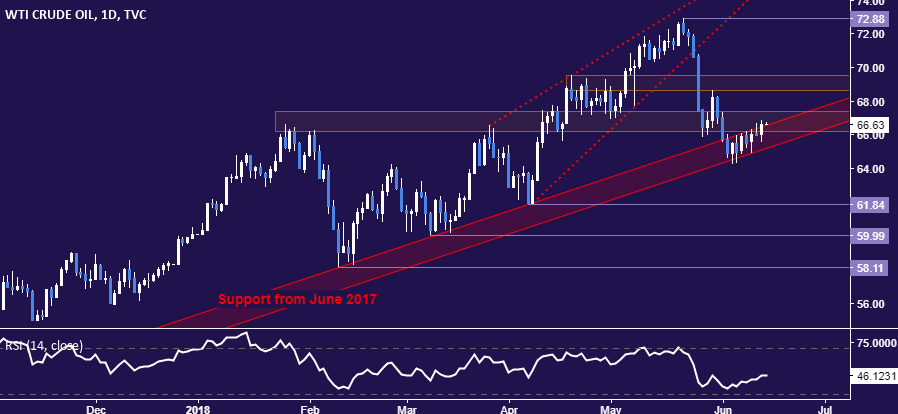
CRUDE OIL TECHNICAL ANALYSIS
Crude oil prices are attempting a recovery from trend support set from June 2017, entering the 66.22-67.36 congestion area again. A daily close above its upper extremity exposes the 68.64-69.53 region next. Alternatively, a breach of trend support at 65.21 initially targets the April 6 low 61.84.
(Click on image to enlarge)
Disclosure: Do you want to see how retail traders are currently trading the US Dollar? Check out our IG Client Sentiment ...
more

