
Crude Oil Prices Soar As Iran Exports Plunge, API Inventory Data Due
Crude oil prices surged after Bloomberg reported tanker tracking data showing exports from Iran fell to a 2.5-year low at 1.72 million barrels in September. This is before the looming re-imposition of US sanctions, which follows the Trump administration’s decision to withdraw from a nuclear disarmament accord with Tehran agreed to by former President Barack Obama. Gold prices marked time after Friday’s upswing.
API INVENTORY DATA ON TAP, FED CHAIR POWELL DUE TO SPEAK
Looking ahead, a weekly oil inventory flow gauge from API is in focus on the economic calendar. The outcome will be judged against forecasts calling for a 900k build to be reported in official EIA statistics on Wednesday. Deviations on the upside may weigh on prices while a smaller inflow or surprise draw will probably prove to be supportive.
Meanwhile, gold prices are looking to comments from Fed Chair Jerome Powell for direction cues. He will be speaking at a meeting of the National Association for Business Economics (NABE). A relatively optimistic stance echoing the tone of last week’s FOMC policy announcement may drive a hawkish shift in the priced-in 2019 rate hike outlook, hurting the yellow metal as the appeal of non-interest-bearing assets fizzles.
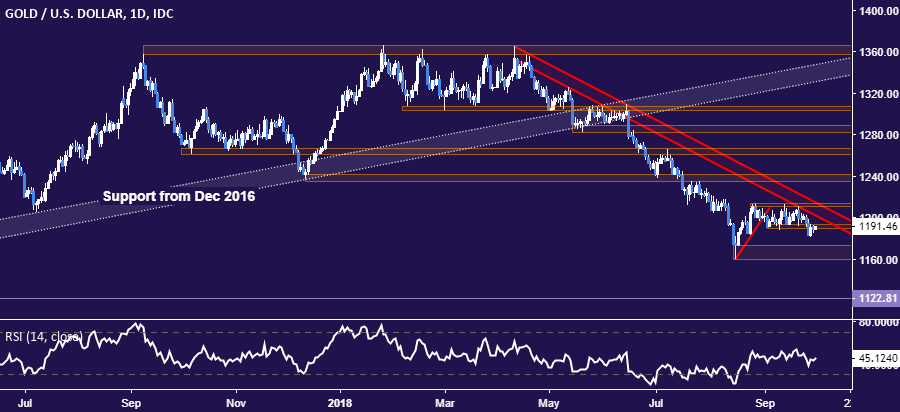
GOLD TECHNICAL ANALYSIS
A corrective upswing in gold prices stalled on a retest of support-turned-resistance in the 1189.76-1193.60 area. A daily close above this barrier paves the way for a challenge of trend resistance, where the outermost boundary is now at 1214.30. Alternatively, a push below support in the 1160.37-73.23 zone targets the December 2016 swing low at 1122.81.
(Click on image to enlarge)
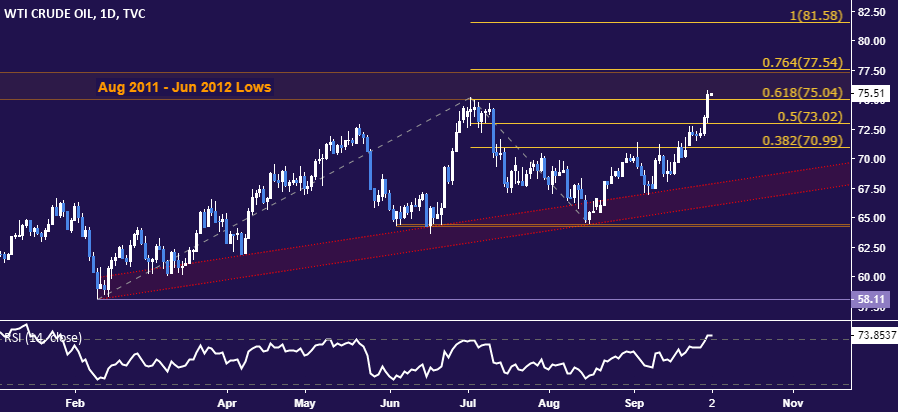
CRUDE OIL TECHNICAL ANALYSIS
Crude oil prices posted the largest one-day rise in three weeks, pushing past July’s swing top to challenge support-turned-resistance marked by swing lows set between August 2011 and June 2012 in the 75.00-77.31 area. This is reinforced by the 76.4% Fibonacci expansion at 77.54. A daily close above that latter level exposes the 100% level at 81.58. Alternatively, a turn back below 75.00 opens the door for a retest of the 50% Fib at 73.02.
(Click on image to enlarge)
Disclosure: Do you want to see how retail traders are currently trading the US Dollar? Check out our IG Client Sentiment ...
more

