Crude Oil Prices Snap 5-Day Win Streak, Eye Inventory Data
Crude oil prices turned sharply lower, snapping a five-day winning streak. The move seems to have reflected easing concerns about escalation in Syria after US President Trump signaled a weekend rocket attack meant to punish the government for using chemical weapons was a one-off. Trump also backed away from sanctions aimed at penalizing Russia for its support of Syrian President Bashar al-Assad.
Meanwhile, gold prices marked time as ebbing geopolitical risk translated into firming risk appetite, boosting Fed rate hike bets while simultaneously undercutting support for the US Dollar. The latter effect seemed to reflect ebbing haven demand as well as the re-emergence of the view that broadening global recovery will see top central banks narrow the US central bank’s lead down the path to stimulus withdrawal. This put gold’s roles as anti-fiat and benchmark non-interest-bearing asset in conflict, translating into standstill.
FED COMMENTARY, API INVENTORY DATA DUE
From here, crude prices are eyeing the weekly US inventory flow statistics from API. The release will be judged against forecasts calling for a meager 600k outflow to be reported in official EIA statistics due the following day. A larger draw might send prices higher. Alternatively, an unexpected build may help extend yesterday’s selloff.
Meanwhile, gold may turn its attention to a steady stream of comments from Fed officials. Remarks from San Francisco branch president John Williams may prove most potent since he has been tapped to take over at the helm of the influential New York Fed after its Bill Dudley steps down. That will put Williams at the forefront of managing the mechanics of Fed tightening, including balance sheet reduction.
Mr Williams has long emerged as an important bellwether for the consensus view on the rate-setting FOMC committee. His new role – due to be assumed in summer – will make his opinions all the more important. With that in mind, a somewhat hawkish tone might revive the greenback’s fortunes to the detriment of the yellow metal.
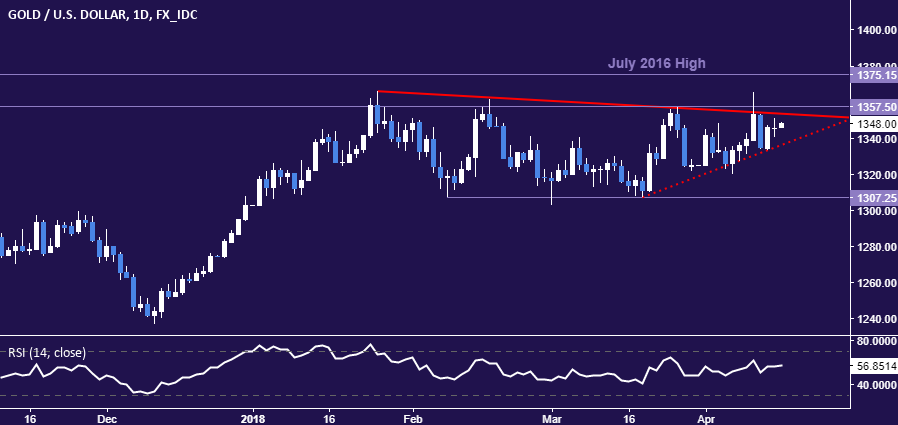
GOLD TECHNICAL ANALYSIS
Gold prices continue to stall below resistance in the 1353.87-57.50 area (double top, falling trend line). Breaking above it on a daily closing basis opens the door for a test of the July 2016 high at 1375.15. Alternatively, a move below near-term rising trend support – now at 1336.63 – exposes long-standing range support at 1307.25.
(Click on image to enlarge)
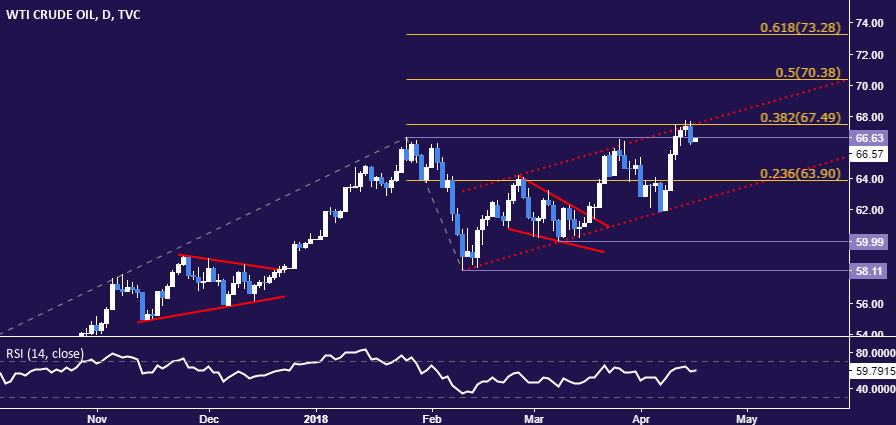
CRUDE OIL TECHNICAL ANALYSIS
Crude oil prices recoiled from resistance cluster in the 66.63-67.49 area (January 25 high, rising channel top, 38.2% Fibonacci expansion). From here, a move back below the 23.6% level at 63.90 opens the door for a test of channel floor support at 62.50. Alternatively, turn above 67.49 sees the next upside barrier at 70.38, the 50% Fib.
(Click on image to enlarge)