
Crude Oil Prices Look Past Trump/Kim Summit, OPEC In Focus
Commodity prices did not stray far from familiar ranges Monday as traders braced for a week packed with top-tier event risk. Crude oil edged up but stopped short of showing directional conviction as traders await guidance on the fate of an OPEC-led production cut scheme.
Russia and Saudi Arabia have voiced support for relaxing output quotas in response to supply disruption in Venezuela and the re-imposition of sanctions on Iran. Other participants in the supply reduction program – such as Iraq, for example – have pushed back against such a move.
A decision may emerge from the upcoming OPEC meeting on June 22 in Vienna. In the meantime, investors will look to soundbites from the sidelines of a World Cup match between Saudi Arabia and Russia this Thursday in Moscow. The leaders of both countries are expected to attend.
As for gold prices, they continued to be locked in place as the US Dollar and Treasury bond yields carve out divergent paths. That puts the yellow metal’s roles as anti-fiat alternative and benchmark non-interest-bearing asset in direct opposition, leaving it rudderless. That may persist until the upcoming Fed rate decision.
OPEC, API AND EIA DATA MAY TOP IMPACT OF TRUMP/KIM SUMMIT
From here, a meeting between US President Trump and North Korea leader Kim Jong-un may offer a bit of a lift to oil prices if signs of a historic breakthrough boost risk appetite. Follow-through may be limited however since any outcome would limited immediate implications for global economic trends.
OPEC’s monthly oil market report is also on tap. Updates of supply and demand forecasts therein may help guide officials’ thinking on output cuts and might prove market-moving. API inventory flow data and an EIA short-term energy market outlook will likewise cross the wires.
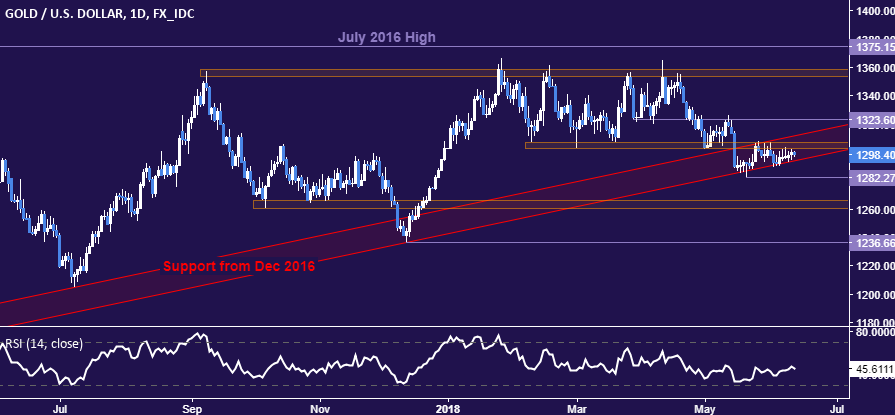
GOLD TECHNICAL ANALYSIS
Gold prices remain anchored to support guiding the move higher since December 2016, now at 1295.02. Breaking that on a daily closing basis targets the May 21 low at 1282.27, followed by the 1260.80-66.44 area. Alternatively, a breach of resistance at 1312.39 exposes former support at 1311.34 for a retest.
(Click on image to enlarge)
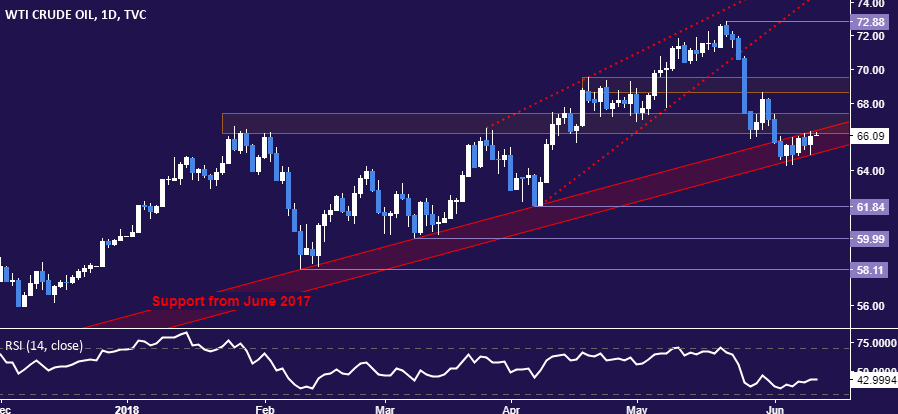
CRUDE OIL TECHNICAL ANALYSIS
Crude oil prices are still trying to find clear direction at support guiding the uptrend from June 2017. A break of its lower extremity, now at 65.05, targets the April 6 low 61.84. Alternatively, a push above resistance in the 66.22-67.36 area clears the way for a test of the 68.64-69.53 zone.
(Click on image to enlarge)
Disclosure: Do you want to see how retail traders are currently trading the US Dollar? Check out our IG Client Sentiment ...
more

