
Crude Oil Pattern Suggesting Crude Could Rally 50%

Is Crude poised to make a giant leap higher in prices? What would the world look like if Crude was to rally 50% from current prices? Below is a chart of Crude Oil over the past 30-years highlighting that Crude has a big test of resistance in play.
CLICK ON CHART TO ENLARGE
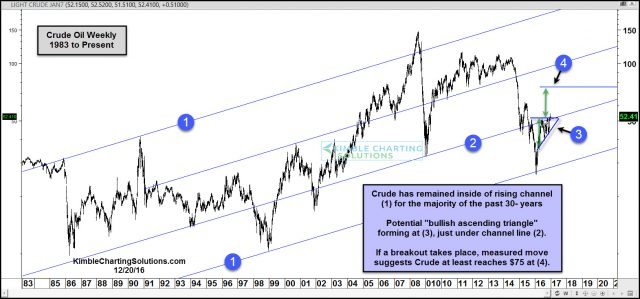
For the majority of the past 30-years, Crude oil has traded inside of rising channel (1). The sharp decline earlier this year in Crude, saw it hit the bottom of the rising channel near the $25 level. Since hitting support, it has rallied higher to now test a parallel channel line.
Crude Oil is facing a very important test of resistance right now at (3), which happens to be the top of a bullish ascending triangle AND channel line (2), at the same time.
If Crude would breakout, the measured move of the ascending triangle suggests that Crude could rally to the $75 level, which is around 50% above current prices.
The Power of the Pattern feels that what Crude does with the top of the ascending triangle, will have large impact on the Energy sector, the broad stock market (SPY) and bonds (TLT).
Full Disclosure- Premium Members hold several long positions in this ...
more

