
Crude Oil And Gold Price Moves May Hinge On US, Japan Trade Talks
Crude oil prices attempted a tepid recovery yesterday following the prior session’s brutal sell-off. The move higher was swiftly aborted however as worrying geopolitical news flow – notably from Russia and Turkey – triggered a selloff in emerging market assets and broadly soured investors’ mood. The sentiment-sensitive WTI benchmark retreated from intraday highs to close with a narrow loss.
Gold price action was likewise muddled by the bloodletting in the EM space. Haven-seeking flows buoyed the US Dollar alongside Treasury bonds, depressing yields. That put the yellow metal’s role as baseline anti-fiat alternative at odds with its character as a non-interest-bearing alternative. Not surprisingly, that translated into inconclusive performance (although sellers narrowly prevailed by the daily close).
US, JAPAN TRADE TALKS MAY TRUMP IEA REPORT AND CPI DATA
Looking ahead, the monthly IEA Oil Market Report may help shape physical flow expectations. Crude prices may edge up if it echoes an EIA prognosis published earlier in the week that envisioned a downshift in US output growth coupled with a pickup in demand. Meanwhile, gold is eyeing US CPI data. Anything short of a wild deviation from forecasts seems unlikely to command attention, however.
On balance, that probably puts sentiment trends back into focus. Continued emerging market turmoil is likely to continue to cloud the landscape but news of a breakthrough in trade talks between US and Japanese officials may tip the scales in favor of a slightly “risk-on” bias. Earlier talks with the EU seem like an apt template, with President Trump eager to give up unpopular auto import tariffs for token concessions. In this scenario, a pickup in bond yields might nudge gold lower while crude oil tracks share prices upward.
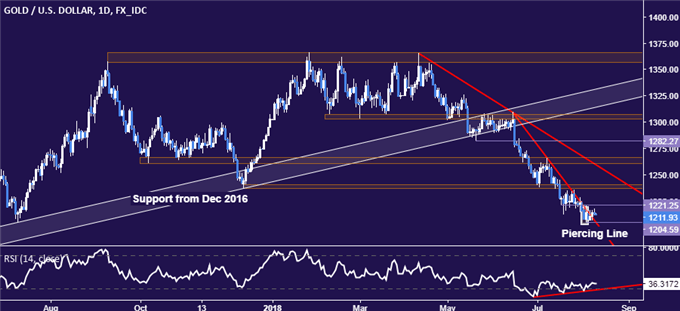
GOLD TECHNICAL ANALYSIS
The formation of a bullish Piercing Line candlestick pattern coupled with RSI divergence hints gold prices may be bottoming. A break above range floor support-turned-resistance at 1221.25 exposes the 1236.6-40.86 area. Near-term support remains at 1204.59, the August 3 low.
(Click on image to enlarge)
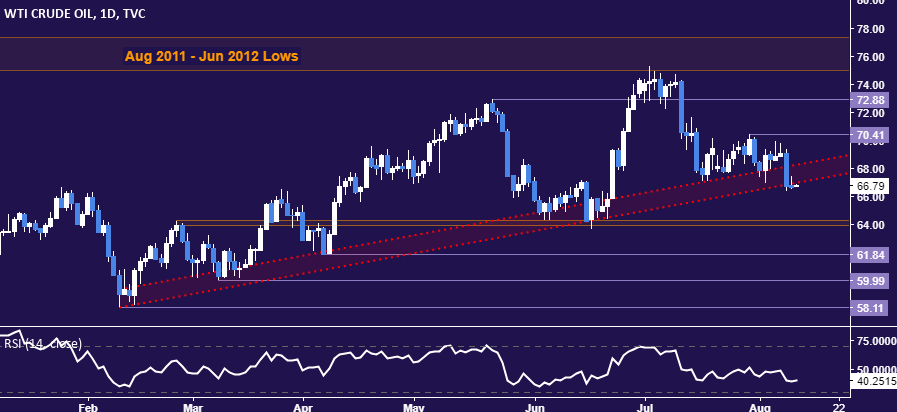
CRUDE OIL TECHNICAL ANALYSIS
Crude oil prices look vulnerable to deeper losses after breaking trend line support established early February. The next layer of support is in the 63.96-64.26 area, with a further move below that exposing 61.84. Near-term resistance is at 70.41, followed by a minor barrier at 72.88 on the way up to the 75.00-77.31 zone.
Disclosure: Do you want to see how retail traders are currently trading the US Dollar? Check out our IG Client Sentiment ...
more

