
Crude Oil – Major Resistances Hold
On Friday, crude oil bounced off session’s low and closed the previous week slightly below $52. Did it change anything in the short term?
Crude Oil’s Technical Picture
(Click on image to enlarge)
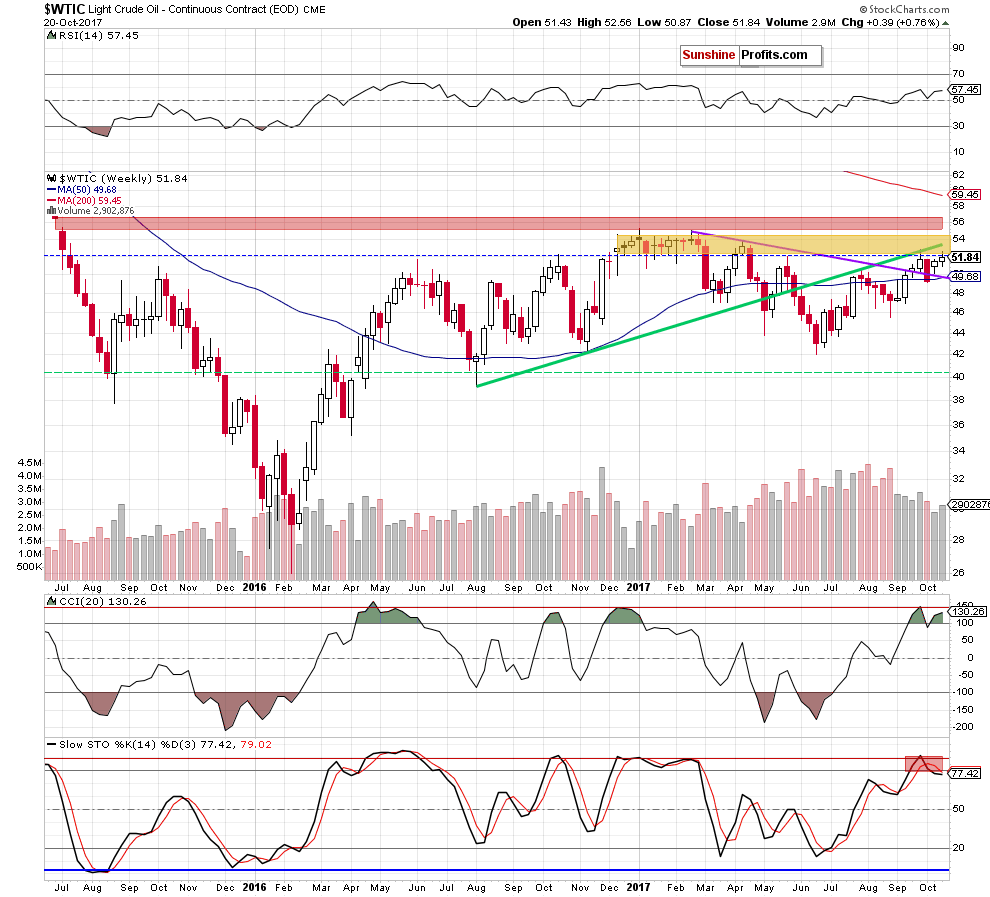
Although crude oil moved a bit higher in the previous week, the overall situation in the medium term hasn’t changed much as the commodity remains not only under the key yellow resistance zone, but also below the May peak. Additionally, the sell signal generated by the Stochastic Oscillator is still in play, suggesting that lower prices are just around the corner.
Will the very short-term chart give us more clues about future moves? Let’s check.
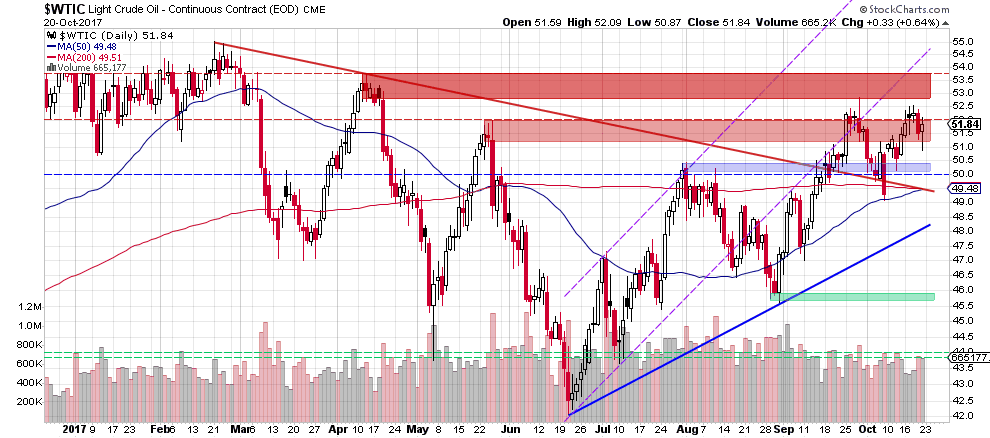
From today’s point of view, we see that although light crude slipped after the Friday market open, oil bulls triggered a rebound, which took black gold to the red resistance zone. Nevertheless, the upper border of the formation together with the previous highs (September and October peaks) continue to keep gains in check, which increases the probability of another attempt to move lower in the coming week.
Crude Oil – Precious Metals Link
This scenario is also reinforced by the current situation in the oil-to-gold and oil-to-silver ratios. Let’s take a look at the charts below.
(Click on image to enlarge)
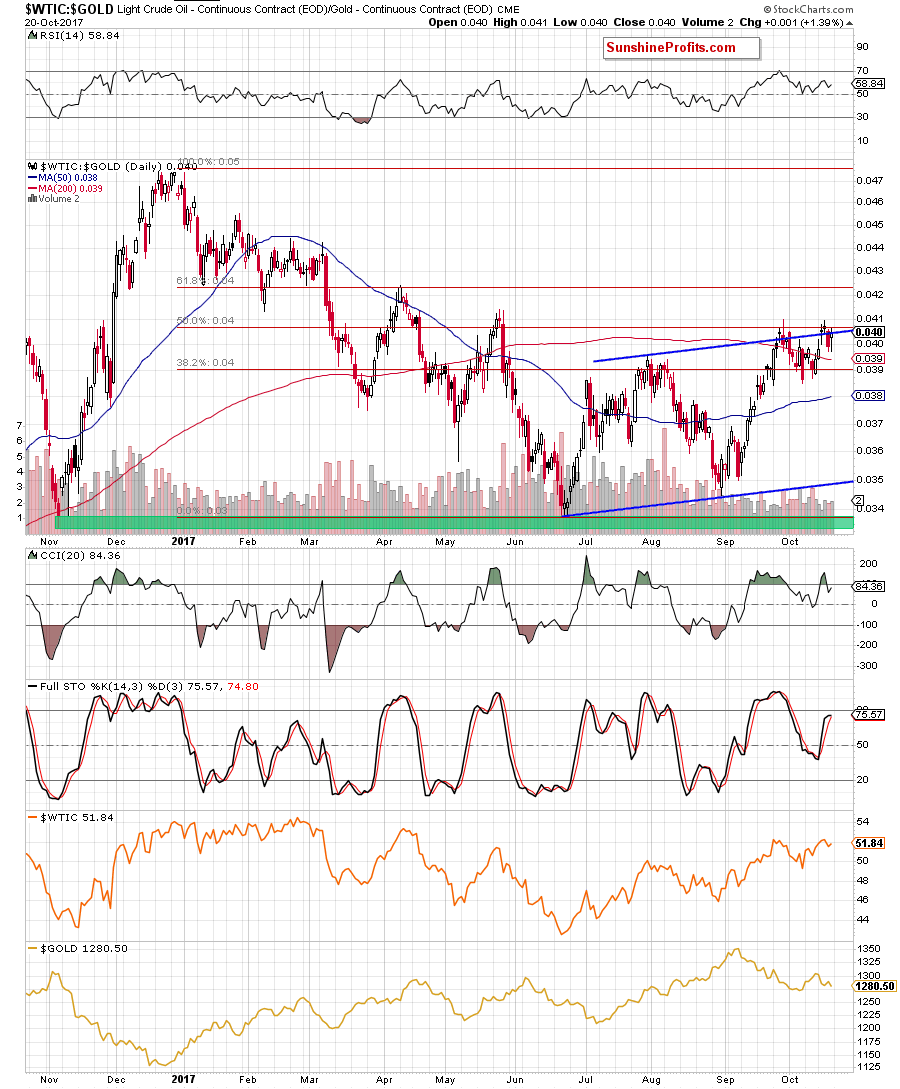
Looking at the above chart, we see that although the oil-to-gold ratio increased on Friday, the 50% Fibonacci retracement, the upper border of the blue rising trend channel and the recent highs continue to block the way to higher levels.
We can also see a similar situation on the daily chart of the oil-to- silver ratio, where the red resistance zone, the 61.8% Fibonacci retracement and the upper border of the black rising trend channel keeps gains in check.
(Click on image to enlarge)
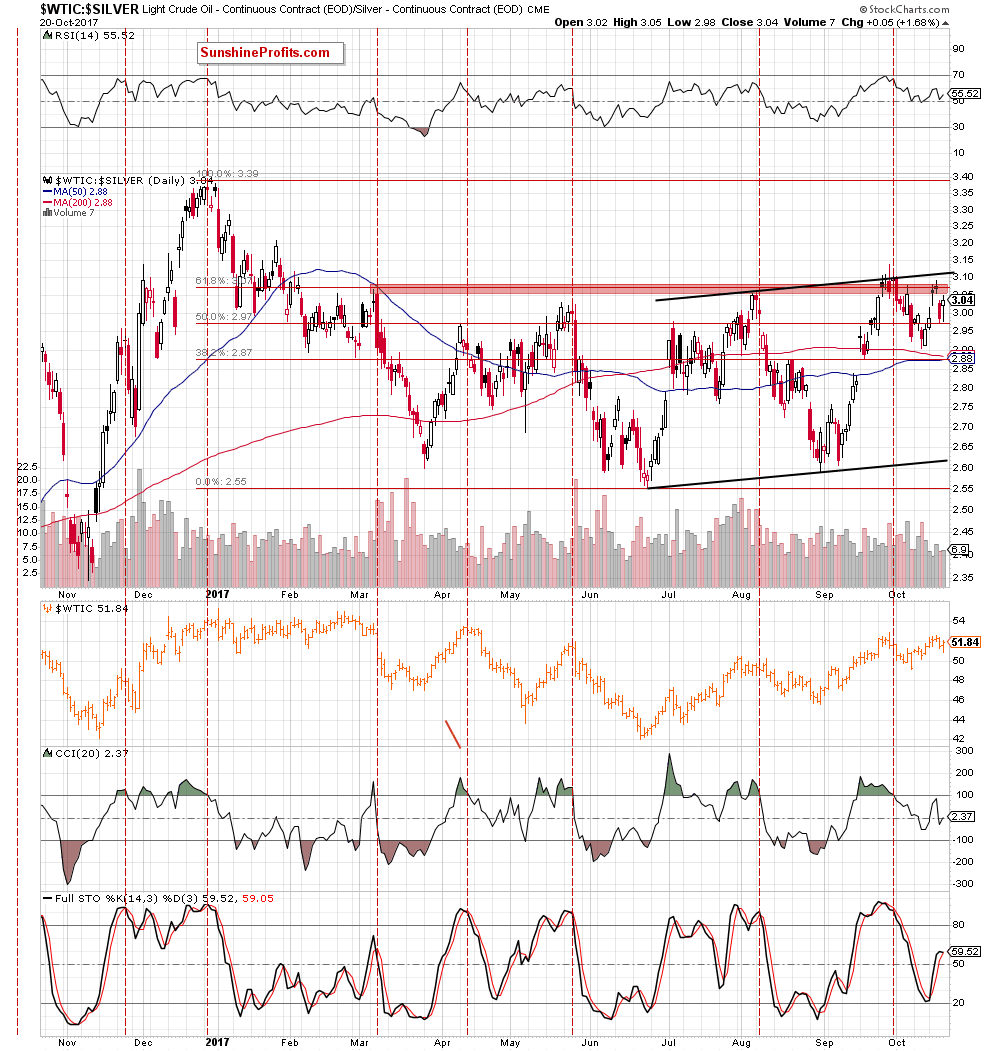
Taking all the above into account, we believe that lower values of the ratios and lower prices of crude oil are very likely in the coming week. Therefore, if light crude reverses and declines from current levels, we’ll see a drop to (at least) the blue support zone created by the August highs (around $50-$50.43) in the following days.
Summing up, short positions continue to be justified from the risk/reward perspective as crude oil is still trading under the major resistance area, which successfully stopped increases many times earlier this year.
Very short-term outlook: bearish
Short-term outlook: mixed with bearish bias
MT outlook: mixed
LT outlook: mixed


