
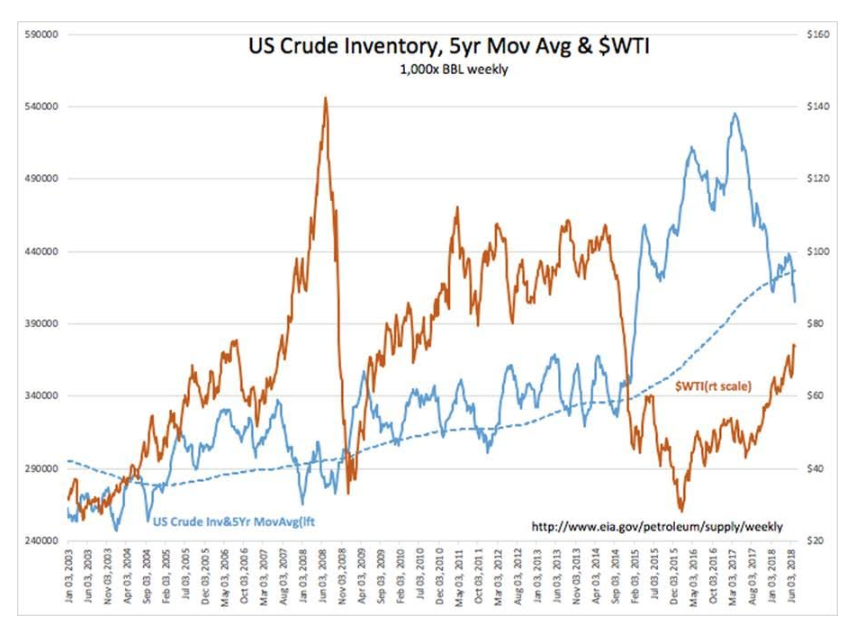
Crude Inventory Below 5yr Avg
“Davidson” submits:
1st:
US Crude Inv drops to 405mil BBL vs 5yr mov avg of 426mil BBL. With the market focus on this relationship, I am surprised by this week’s price response to the 12mil BBL decline in US Crude Inv. I think the issue is that algorithms are tied inversely to US$ strength and this is confusing when we have had both oil prices and US$ trending in the same direction At some point we experience a sudden shift as algorithms are found to not be working as expected. The effect is a price change which does not appear to make economic sense with the headline.
My guess is oil prices should resume their rise as global demand continues to rise and traders adjust the algorithms. We are in the seasonal down-trend for US Crude Inv as we convert to inventories of Refined Products sufficient to meet demand during the Fall seasonal catalyst-change-over period.
With some focused on 5yr mov avg of US Crude Inv, I think it likely we will hear some issue bullish price expectations in coming weeks.
(Click on image to enlarge)
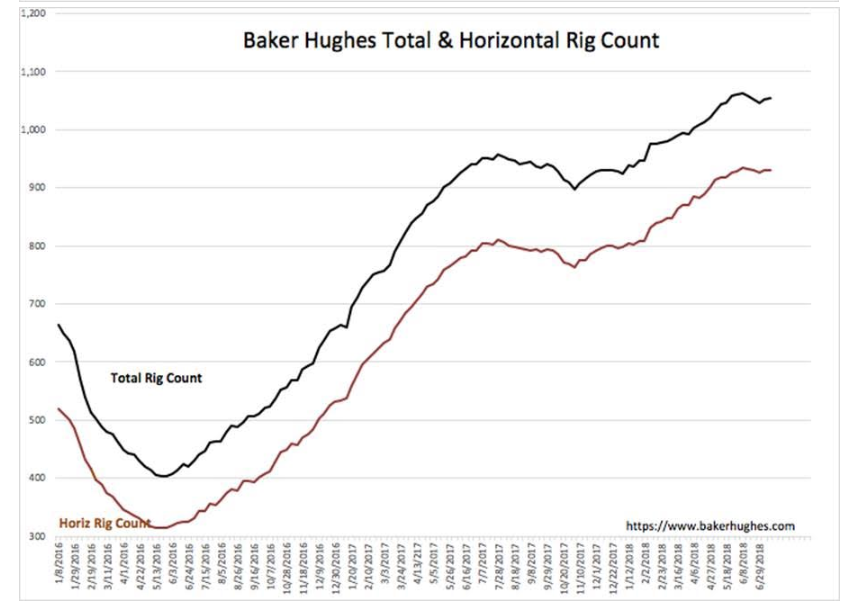
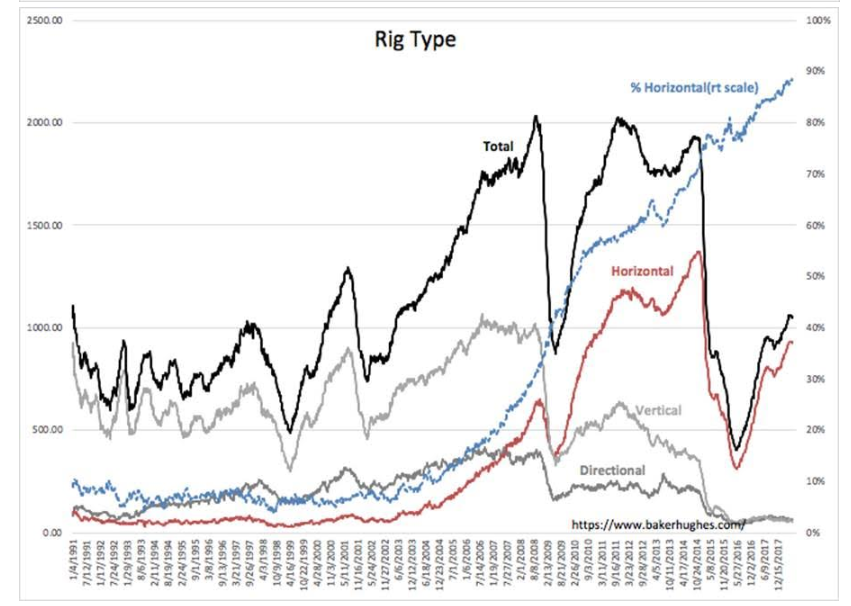
2nd:
Horizontal rigs as a percentage of the Baker Hughes No American Rig Count continue to inch higher with this week’s report 88.2% of all rigs vs. last week’s all-time high of 88.4%.
Interesting that the overall rig count has stalled last ~30dys. Is this about fewer rigs doing more, not enough crews, a decision about rising costs hurting returns? The reason is not clear at the moment.
(Click on image to enlarge)
(Click on image to enlarge)
Disclosure: The information in this blog post represents my own opinions and does not contain a recommendation for any particular security or investment. I or my affiliates may hold positions or ...
more

