
Crude Breakdown Could Take Stocks With It, Says Joe Friday
When an asset takes out horizontal resistance to the upside, it is nice to see the old resistance tested as new support, before pushing higher.
The S&P 500 traded sideways for nearly 18-months, before breaking out to the upside and then testing old resistance as new support at (1) below. Once this support held, the S&P took off to the upside in short order.
(Click on image to enlarge)

The US$ chart on the right reflects that that is has traded sideways for nearly two years. It broke above old resistance and came down to test it as support at (2). Could the US$ be testing old resistance as new support, in preparation to move much higher like the S&P 500?
Joe Friday Just The Facts; If King Dollar does duplicate the pattern of the S&P 500, Crude Oil should be put under pressure.
Recently we shared on Zero Hedge, that the Crude Oil Fear index had formed a bullish falling wedge (two-thirds odds of a rally) and Crude Oil looked to have formed a bearish rising wedge (two-thirds odds of a decline). See full article HERE.
Full Disclosure- Premium Members are 2x short crude oil since last week.
If Crude would give way, could it impact the broad market?
(Click on image to enlarge)
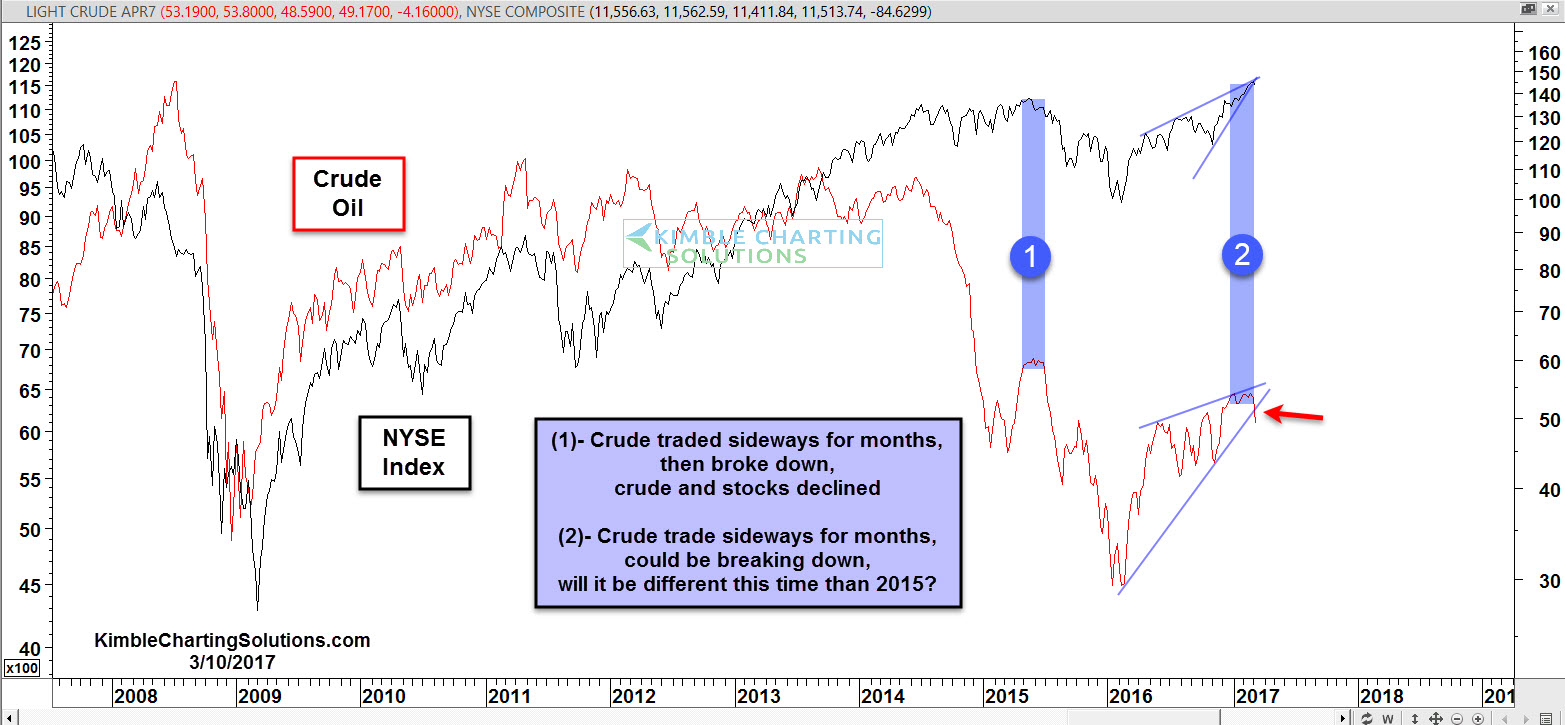
Joe Friday Just The Facts; Investors might want to pay close attention to what Crude Oil does at (2), could impact the broad stock market, were it to repeat 2015 pattern.
Disclosure: Sign up for Chris's Kimble Charting Solutions' email alerts -- more


