
Crises And Opportunity – Possible End Of The Line For Stocks
There is not one person living today that has seen a period of overvaluation such as the one we are living through right now. And there are few people still alive who witnessed a crash similar to the one we are about to experience.
The market hit such an extreme level last week, that it brought the long-term valuation metrics I follow to a level higher than the property bubble highs of 2007, the DOTCOM bubble highs of 1999, the cocaine highs of 1987, the space age highs of 1966, and the roaring 20's highs of 1929.
This bubble that we are living through is the most over-valued extreme in history - bar none! And the market is now trading at 3X the long run historical average for those valuation metrics.
If that wasn't bad enough, people and corporations have never been so leveraged in history. As a society, we are in very bad shape to weather the depression. Also on this ocassion, there will not be large scale government intervention to save failing banks, or insurance companies, and whoever else is laid low in the coming depression and the incredible web of counter party risk that exists right now.
The political will does not exist anymore, plus, politicians have an aversion to sticking their necks out when the public has their knives sharp and ready.
This bubble is so large and the crash will be so devastating. My major worry over the 10 years is not the coming depression, it is the coming war after the coming depression and then there are going to be a whole lot of angry people knocking around.
So, while the world is enjoying the dying moments of this epic orgy of speculation, you should take this the time to ready yourself for the tumult that is upon us and after that the opportunity that is to come.
Make sure you are still solvent when valuations are in the exact opposite position as they are now. When stocks like AMZN stock will sell for a p/e of 5, rather than the insane 324 X its sits at today. The time is coming.
UPCOMING RISK EVENTS:
USD: ADP Non-Farm Employment Change, Chicago PMI, Crude Oil Inventories, FOMC Statement, Federal Funds Rate.
EUR: CPI Flash Estimate y/y, German Retail Sales m/m.
GBP: n/a
JPY: n/a
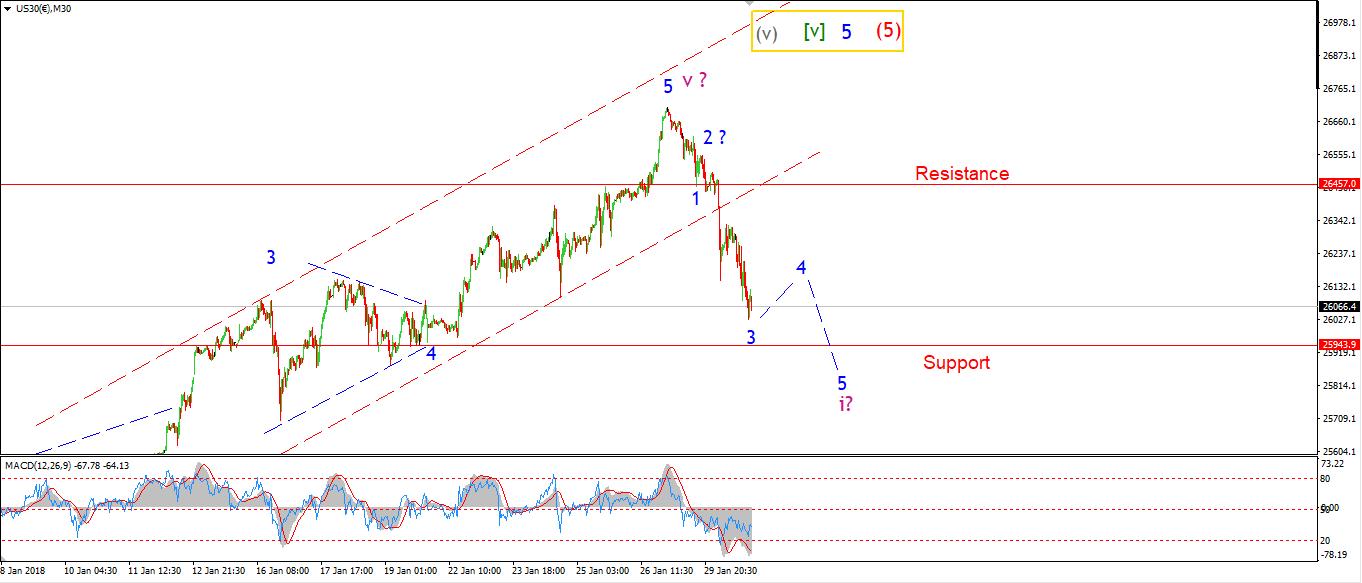
DOW JONES INDUSTRIALS
30 min
(Click on image to enlarge)
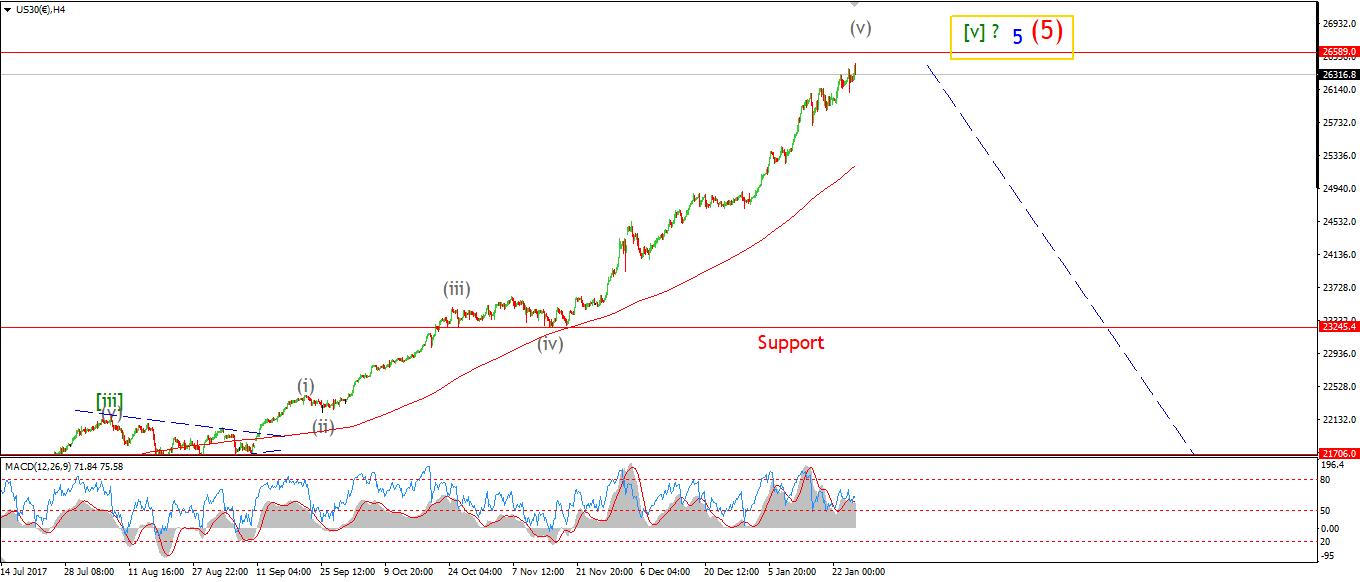
4 Hours
(Click on image to enlarge)
Daily
(Click on image to enlarge)
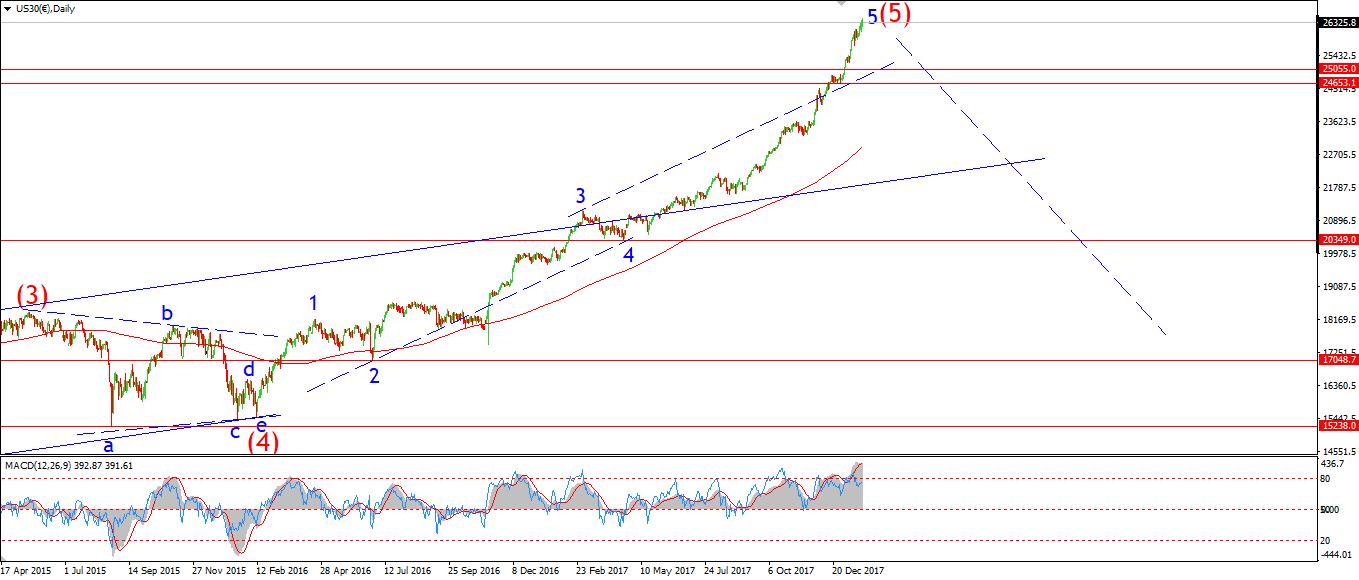
My Bias: market topping process completing
Wave Structure: Impulsive 5 wave structure, topping in an all time high.
Long term wave count: topping in wave (5)
This weeks action has seen the first meaningful decline in stocks in over a year! That is one heck of an achievement. It is going to take something bigger to break the back of those relentless bulls, but something bigger is definitely on the cards now!
The decline off the high is possible to read as a developing five wave pattern to the downside, the gap lower this morning can be viewed as an extension lower in wave '3' blue. This wave count calls for a consolidation in a possible fourth wave now. And then a further break of initial support at 25940 to complete a five wave pattern.
If that price action occurs, the next thing to look for will be a three wave rally in wave 'ii' pink to create a large elliott wave signal off the high and the possibility for an even larger decline in wave 'iii' pink.
This is all speculation as yet, but, so far so good for the beginning of a new bear market!
Tomorrow watch for a three wave correction in wave '4' blue, wave '4' must now rise above 26457 the wave '1' low.
Gold
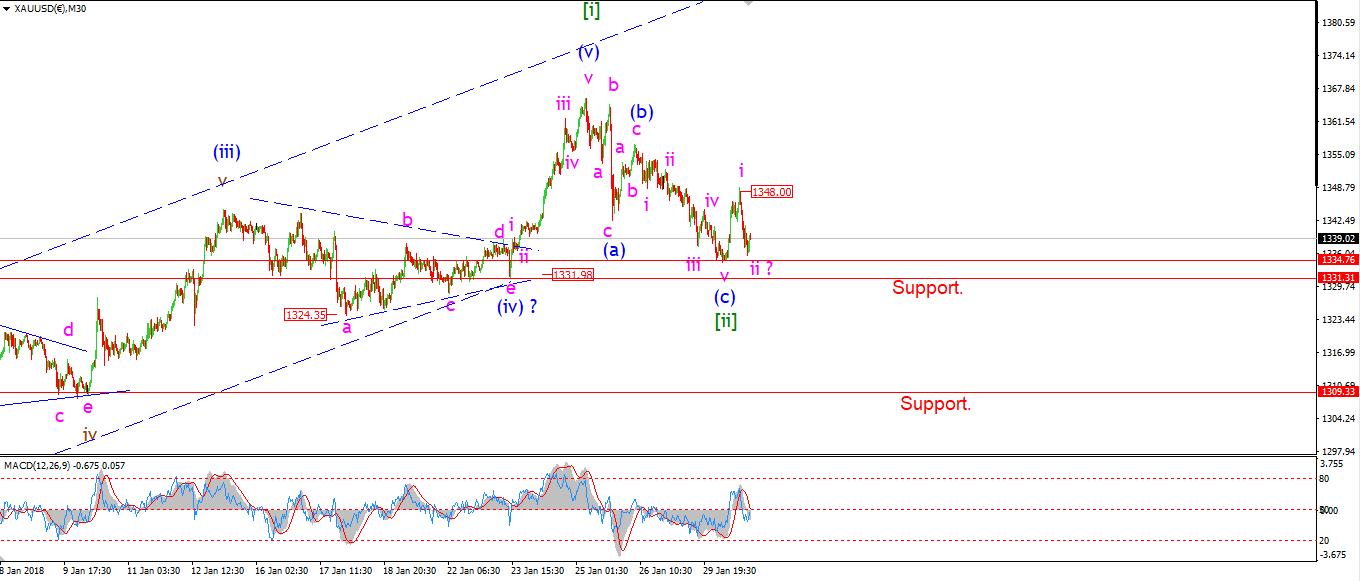
30 min
(Click on image to enlarge)
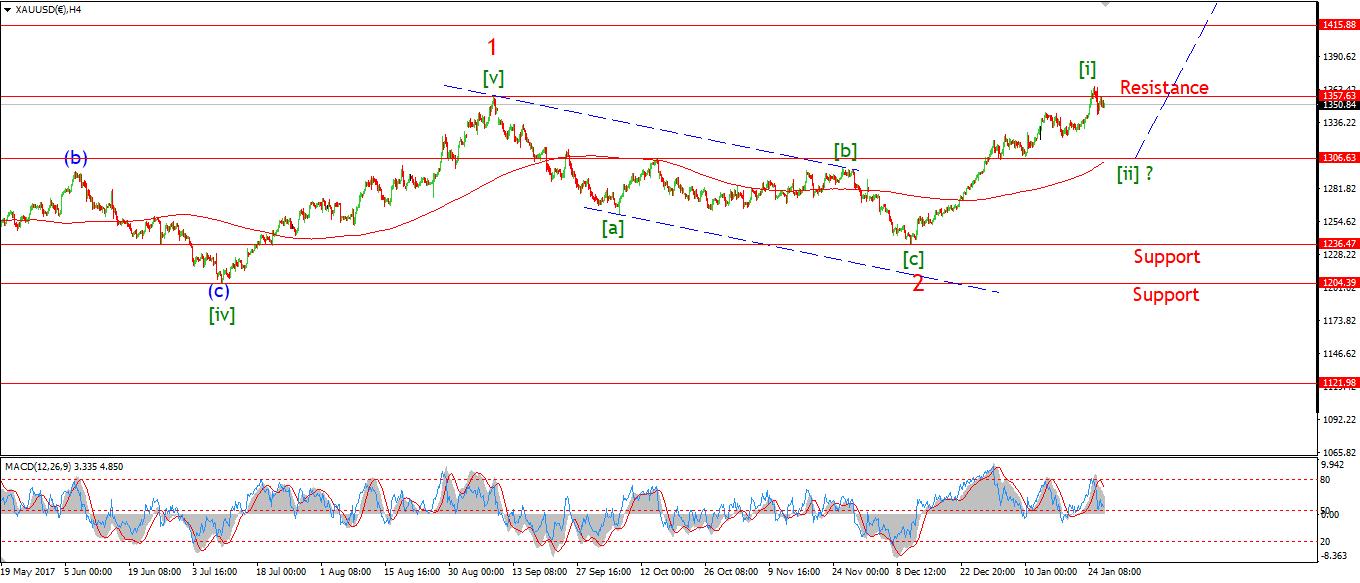
4 Hours
(Click on image to enlarge)
Daily
(Click on image to enlarge)
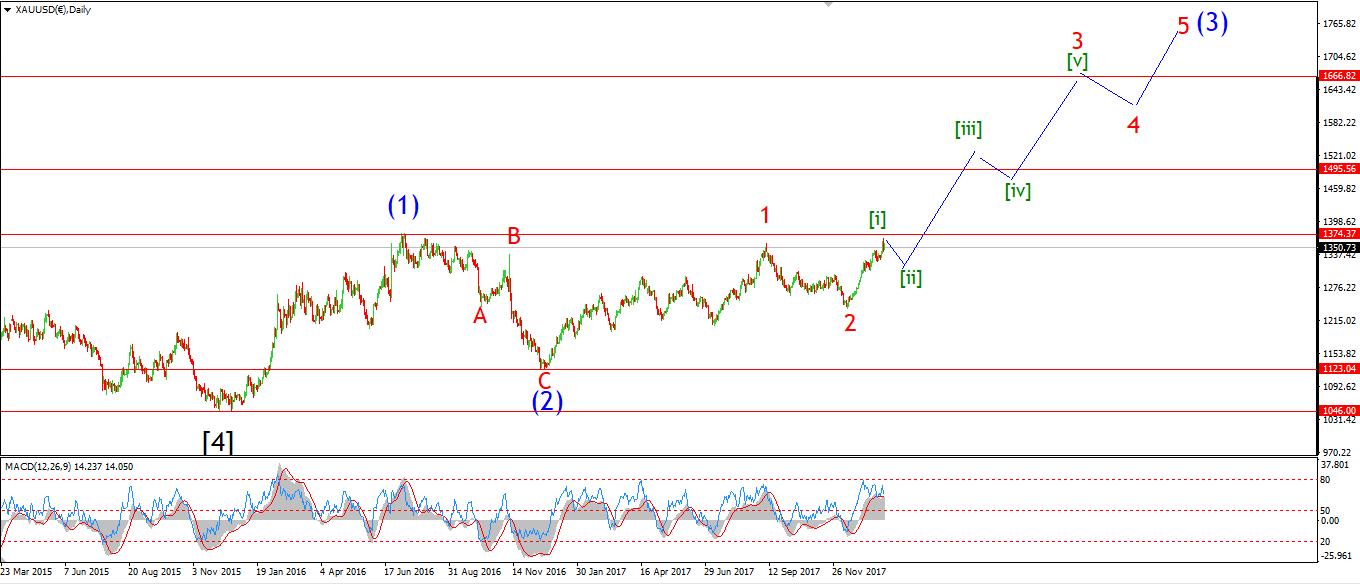
My Bias: Long to a new all time high above 1827.
Wave Structure: Impulse structure to a new high.
Long term wave count: wave (3) above 1666.
Today's low hit 1334.76 in the cash market. Off that low the price spiked in a nice impulsive looking form. I have labeled that rally as wave 'i' pink with wave 'ii' retracing close to the low of the day.
It is now possible that wave [ii] green is complete, and the price is setting up for a large rally in wave [iii] green. 1334.76 must hold for this short term bullish signal to remain valid.
If we see another break above 1348, that will add significant weight to this bullish interpretation.
Tomorrow, 1334.76 must hold from here, watch for a further higher low to kick off wave 'iii'.
Want to know the next big move in the Dollar, GOLD and the DOW?
Check out our membership plan over at ...
more

