
Copper Pauses At Key Technical Level
(Click on image to enlarge)
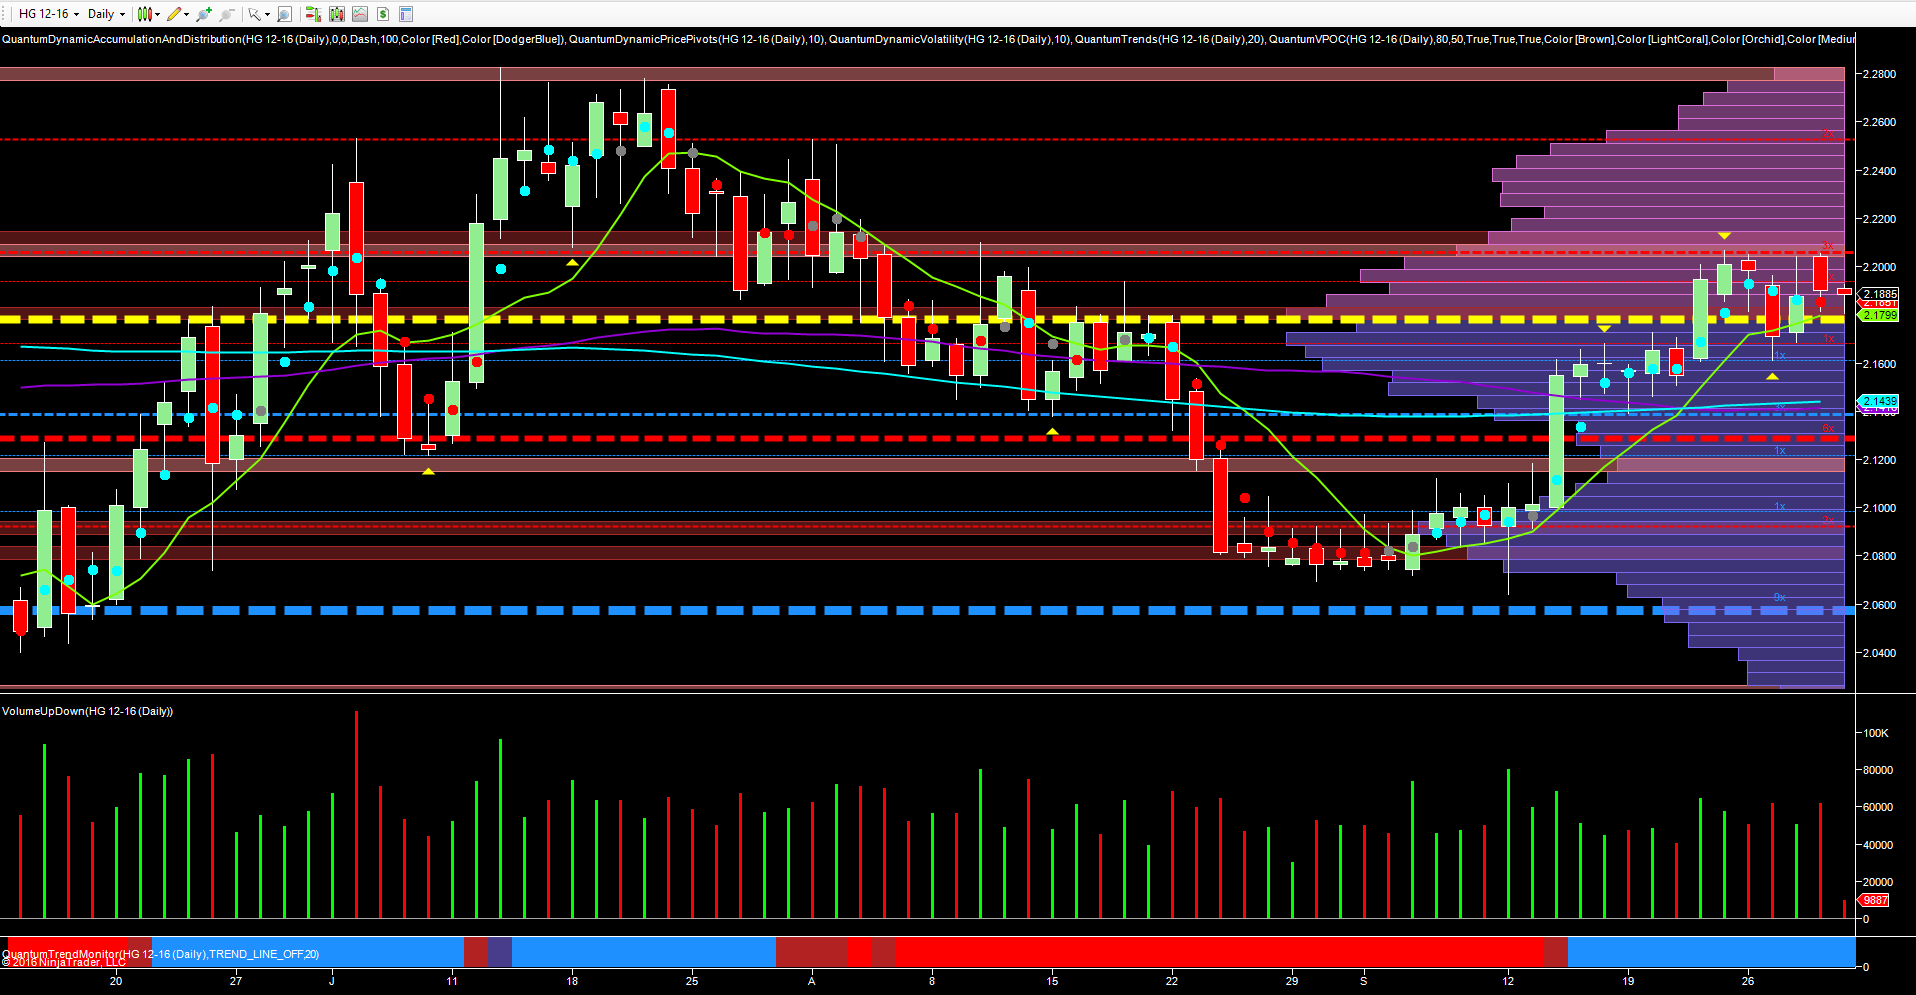
The bullish trend for copper that I signaled in a post earlier in the month, now appears to have come to a halt, with the red metal running into some stiff price resistance in the $2.2050 lbs region on the daily chart, and this price point now developing into a key level. To date this has been tested on four occasions in the last two weeks, and clearly defined with both the pivot high along with the distribution region denoted with the red dotted line.
In addition, the volume point of control is now firmly anchored below in the $2.1795 lbs region, suggesting further consolidation in this area as volumes continue to build. With plenty of price support now in below, the key for any continuation is twofold. First, rising volume on any move through the $2.2050 lbs, and second continued positive news from China. This was the trigger for the initial surge higher as the big operators moved in en masse on the 12th of September with the deep hammer candle and strong volume, following the congestion and accumulation phase duly followed by the news itself on the 14th September.
In the most recent CFTC report the hedge funds and money managers have cut their net short positions by 17,047 to 19,568 which continues the pattern of the previous week which were also reduced. Open interest also fell by 10%. The longs rose from 48,564 to 49,616 whilst the shorts fell from 85,179 to 69,184 and reflecting the shift in sentiment for copper following its longer-term bearish trend.
Disclaimer: Futures, stocks, and spot currency trading have large potential rewards, but also large potential risk. You must be aware of the risks and be willing to accept them in order to invest in ...
more

