
Continuing A Topping Pattern?
Market Overview
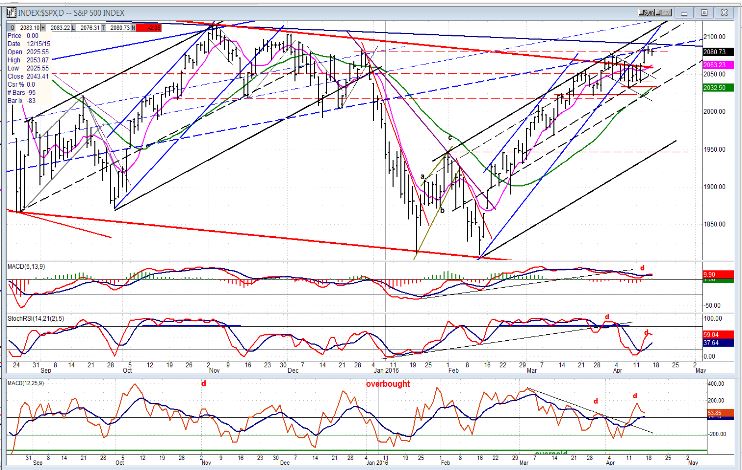
In the last newsletter, I mentioned that the pattern that the SPX was making looked more like a consolidation than anything else, and that it would have to decline at least below 2043 to alter it. The index made a couple of half-hearted attempts at breaking that support level, but buyers immediately stepped in and caused it to rally. By Thursday, we were on our way to a new high, but the advance stalled on Friday at 2088.
The re-accumulation pattern which formed above the 2043 level called for conservative count to 2088-2094. There is also a weak, liberal count that could take the index as high as 2123. Positive news coming from Doha on Sunday could be the catalyst which drives prices to that level.
It is clear that, as of Friday, the SPX had not conclusively made a rally high, although it did reach the lowest projection level of 2088 and started to back-off. For a confirmed reversal, we would need to see it decline not only below 2043, but 2020 as well. Since nothing has changed (as we will see later) in the relative positions of the leading indexes to the SPX, we can only assume that the rally which started at 1810 is still looking for a price level at which to end, and that last week’s rally extension is not the start of a new uptrend.
SPX Chart Analysis
Daily chart (This chart, and others below, are courtesy of QCharts.com.)
At the moment, we cannot derive any firm conclusion from last week’s action, but by next week, the index should be in a position to tell us more about its intentions. Until it reached 2075, it traded in a blue channel, came out of it last week and back-tested it as it made a new high. It also appears that it is now moving in a larger, less steep, black channel, thereby continuing to mimic the pattern that it made when it rallied from the September 2014 low, except that back then, the move out of the first channel was much weaker. Currently, it is also diverging from the former pattern by making a new high after coming out of the blue channel.
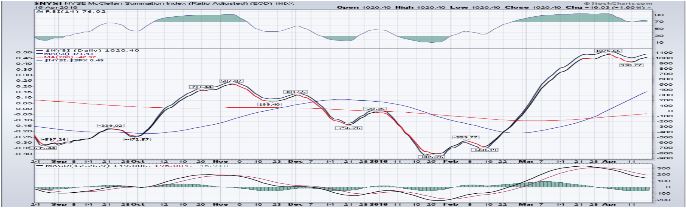
In order to get a better perspective on what the SPX is doing, I have posted the NYSI (courtesy of StockCharts.com) directly below it. What is immediately apparent is that breadth has been much stronger than price -- until the last couple of weeks when it started to diverge from it. It is also very overbought and needs to correct. In that sense, it adds to the perception that the SPX should soon find a top and start to pull back. The relative strength of the NYSI is directly opposite to the relative weakness of the leading indexes posted lower. Note that the indicators at the bottom of the price chart are all showing negative divergence, which also suggests that a price reversal is near. Not to mention the Greed and Fear index which is strongly in the greed column.
As for the longer trend, we will have to wait and see how much of a pull-back we get in the next down leg, and what follows. For now, the index is correcting within a wide and volatile range with swings of 200+ points. Eventually, it should come out of this pattern on the upside or on the downside. Odds still favor the latter.
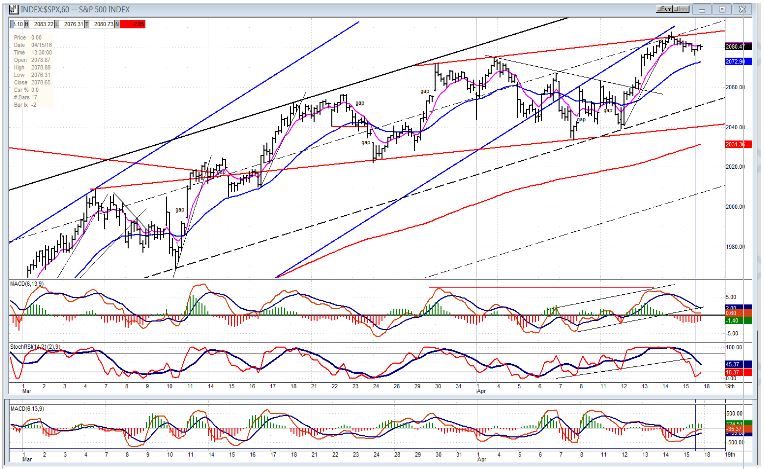
Hourly chart
The hourly chart shows why the SPX found support where it did. Besides the fact that 2043 is a pivot point, it also bounced off two intersecting parallels. The rally from that level not only stopped when it back-tested the bottom line of the blue channel, but when it met with the top of the red channel -- a level which also corresponded to the lowest projection from the re-accumulation pattern.
The shallow correction which occurred over the last two days brought the indicators down from their overbought level and they look ready to turn back up. Of course, the direction that the index takes over the short term will depend on the results of the Doha meeting, on Sunday.
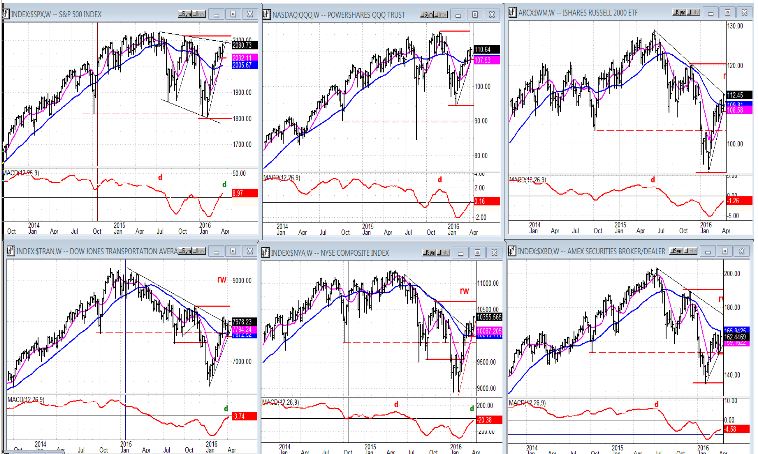
SPX et al…
Instead of showing you the daily charts of the leading indexes vs. the SPX, I decided to post the weekly charts which, as you can see, are far more revealing of the lack of coherence which exists in the internal market structure. Every one of these key indexes is diverging from the SPX (top left); especially those which are the most reliable: the IWM (top right) and the three lower ones (TRAN, NYA, and XBD). How can the SPX be resuming its bull market trend under these conditions?
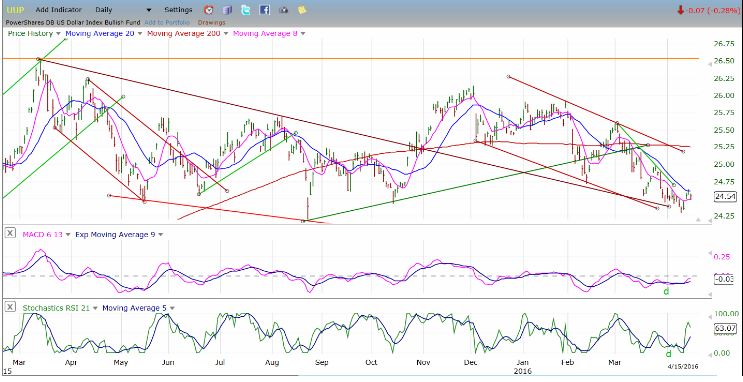
UUP (Dollar ETF)
The dollar has continued to correct but, after reaching the bottom of its down channel while showing positive divergence in the indicators, it is attempting to reverse. Although the trend could be turning, the weekly indicators still need to do more work before it can move much higher.
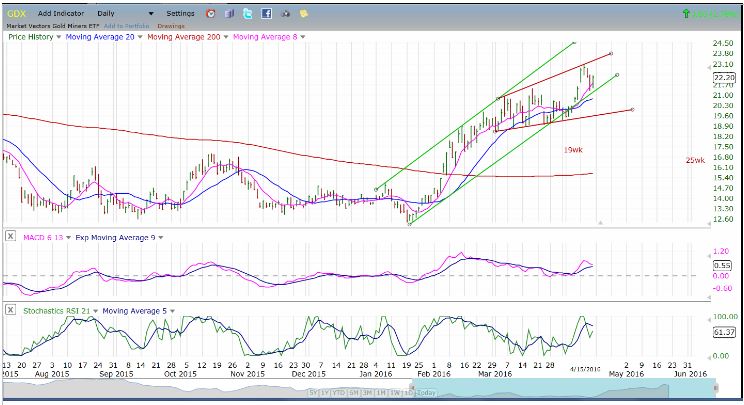
GDX (Gold Miners ETF)
It looks as if the 19wk cycle came in a week early and completely nullified the H&S pattern that had been created. The index pushed on to a new high, and retraced about 50% of its move last week. The 25wk cycle, whose low is about 6 weeks away, could curtail its up-move and create a deeper retracement. GDX benefited from some analysts’ recommendation of gold mining stocks, but gold itself is much weaker and did not even come close to making a new high. If neither can make more headway next week, this may turn out to be a false break-out for GDX with a decline to follow into the last part of May or early June.
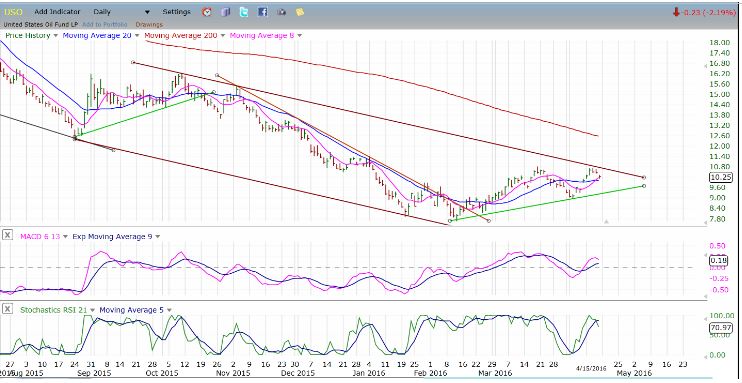
USO (US Oil Trust)
USO re-tested its recent high and was stopped by the top line of its declining channel. If oil producers can come to an agreement (tomorrow) about freezing production USO should have no trouble breaking through and perhaps reaching its potential projection about a point higher. If not, it should pull back into its base and help the SPX to start reversing.
Summary
Although the SPX pushed to a new rally high last week, it does not look like a resumption of the bull market. One could point to the NYSI relative strength as a sign of internal strength, but this is contradicted by the relative weakness of key leading indexes. The near-term direction will be dictated by how the Doha meeting results influences the price of oil. We need to get that out of the way before getting a good reading on what the market wants to do.
Disclosure: Market Turning Points is an uncommonly dependable, reasonably priced service providing intra-day market updates, a daily Market Summary, and ...
more

