
Commodity Leaders And Laggards
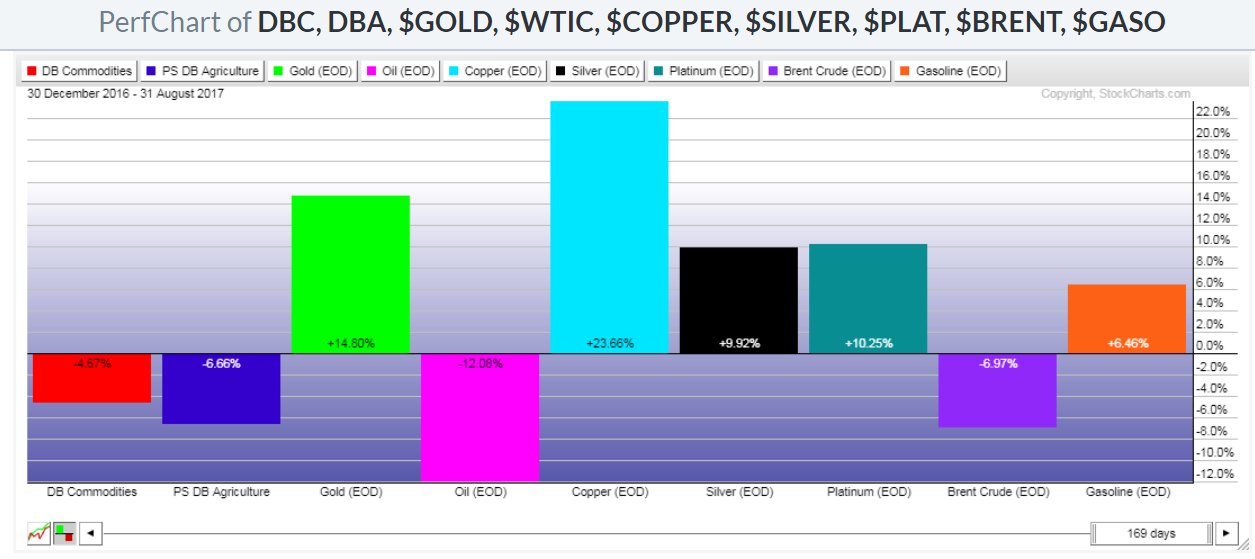
The following Year-to-Date and 2-Week graphs show which commodities (and commodity ETFs) have gained and lost the most (in terms of percentage) during those two time periods.
The second graph illustrates the massive 18.92% gains made in Gasoline during these past two weeks...no doubt, in anticipation of, and with respect to, current events surrounding the refinery shut-downs in Texas this week, due to the effects of Hurricane Harvey.
On a Year-to-Date basis, the laggards are WTIC Crude Oil, Brent Crude Oil, and the Agriculture ETF, while Copper leads in gains, followed by other metals.

The following 1-Year charts of these seven commodities and two ETFs show that all of these are mired within prior price resistance zones, except for the Agriculture ETF (DBA), and Copper, which are at their respective low or high points (and in their well-defined down or up trends) during this time period.
These are two to watch, along with WTIC Crude Oil, Brent Crude Oil and Gasoline, in the coming days and weeks for signs of, either, trend reversal, or, continuation.

Disclaimer: All the information contained within my posts are my opinions only and none of it may be construed as financial or trading advice... please read my full Disclaimer more


