
Closer To Breakout
The main U.S. stock market indexes were mixed between -0.4% and 0.0% on Friday, as investors continued taking profits off the table following early May rally. The S&P 500 index remains above 2,700 mark, and it currently trades 5.8% below January 26 record high of 2,872.87. The Dow Jones Industrial Average was unchanged and the technology Nasdaq Composite lost 0.4% on Friday.
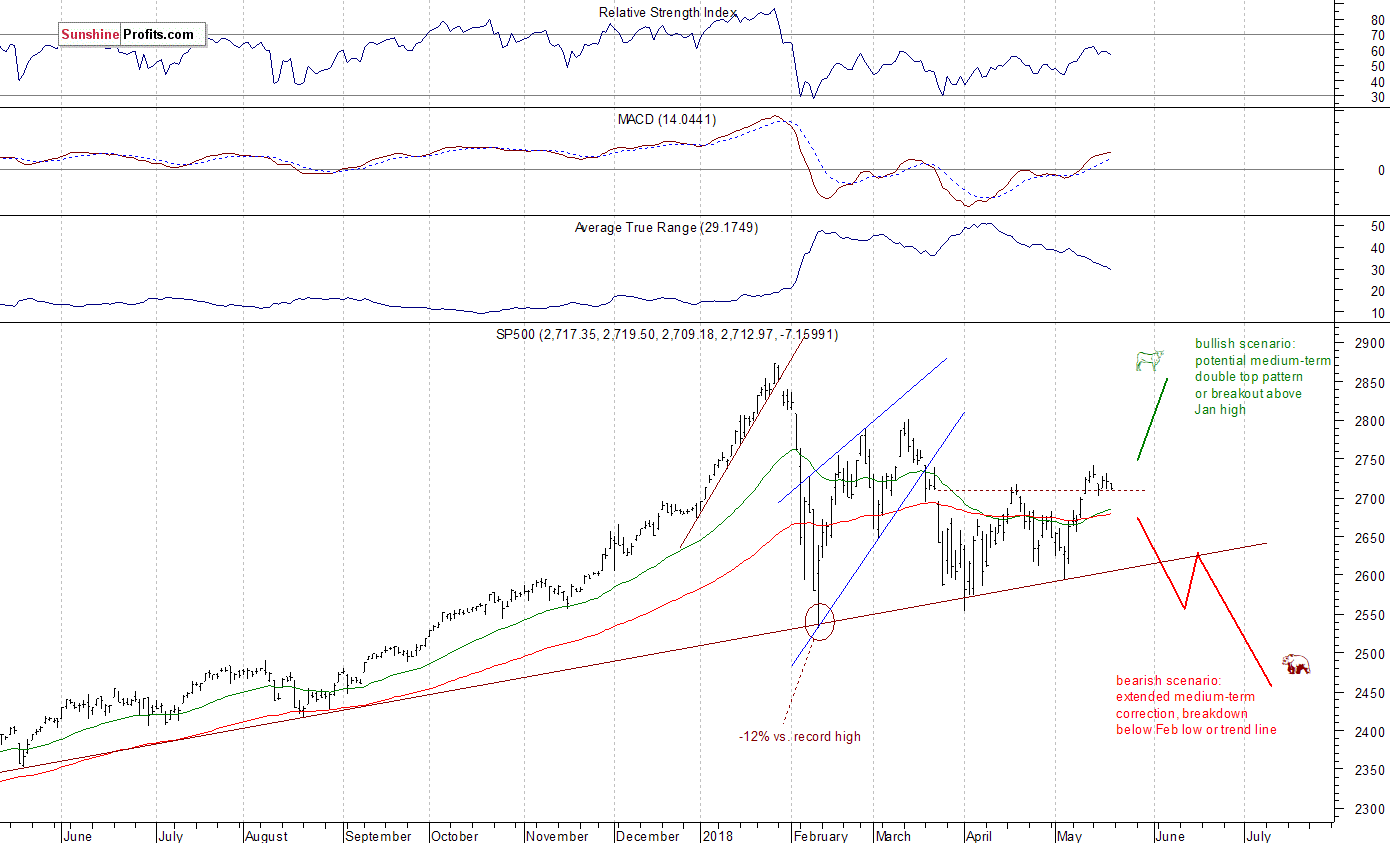
The nearest important level of resistance of the S&P 500 index remains at around 2,720-2,725, marked by last Tuesday's daily gap down of 2,718.59-2,725.47, among others. The next resistance level is at 2,740-2,750, marked by mid-March local high. On the other hand, the support level is at around 2,700-2,710, marked by previous Thursday's daily gap up of 2,701.27-2,704.54 and recent daily lows. The support level is also at 2,680-2,685, marked by previous resistance level.
The broad stock market extended its short-term uptrend in the beginning of the month, as the S&P 500 index broke above the level of 2,700 again. Stocks lost some ground on Tuesday a week ago, but it didn't look like a new downtrend. Since then, the market traded within a consolidation. So, will the run-up continue towards 2,800? There are still two possible medium-term scenarios - bearish that will lead us below February low following trend line breakdown, and the bullish one in a form of medium-term double top pattern or breakout towards 3,000 mark. There is also a chance that the market will just go sideways for some time, and that would be positive for bulls in the long run (some kind of an extended flat correction):
Positive Expectations, but What's Next?
The index futures contracts trade 0.6-0.9% higher vs. their Friday's closing prices, as investors react to the U.S. - China trade talks. So, expectations before the opening of today's trading session are positive. The European stock market indexes have gained 0.6-0.7% so far. There will be no new important economic data announcements today. The broad stock market will probably extend its week-long fluctuations following higher open at 9:30 a.m. There have been no confirmed negative signals so far. It looks like a flat correction within an uptrend. However, if the index doesn't break above its recent local high pretty soon, we could see some more profit-taking action.
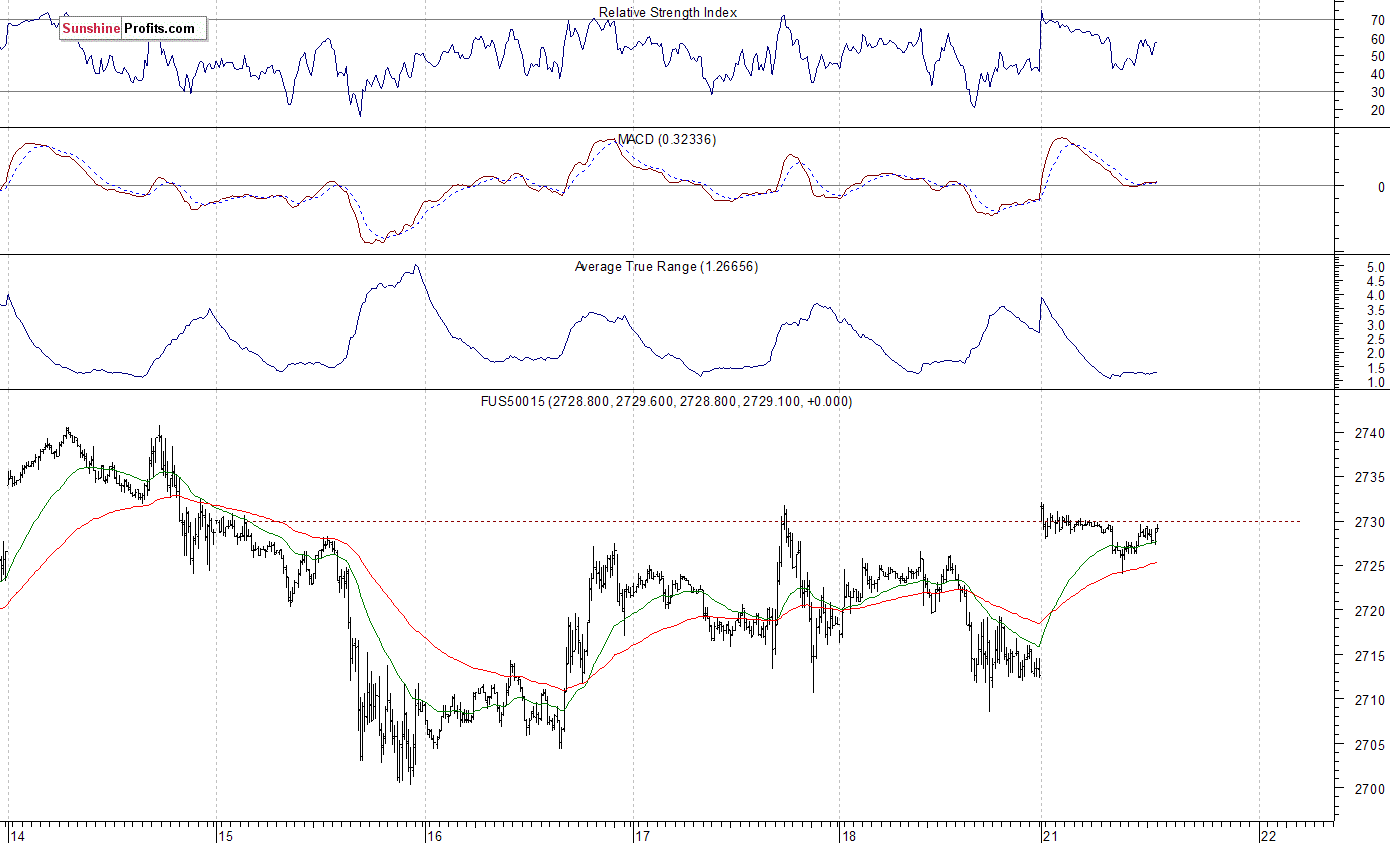
The S&P 500 futures contract trades within an intraday consolidation, following overnight move up. The nearest important level of resistance is at around 2,730-2,735, marked by local high. The next resistance level is at 2,740, among others. On the other hand, support level is at 2,715-2,720, marked by Friday's fluctuations. The support level is also at 2,700-2,705. The futures contract trades along its recent local highs, as we can see on the 15-minute chart:
Nasdaq Above 6,900 Again
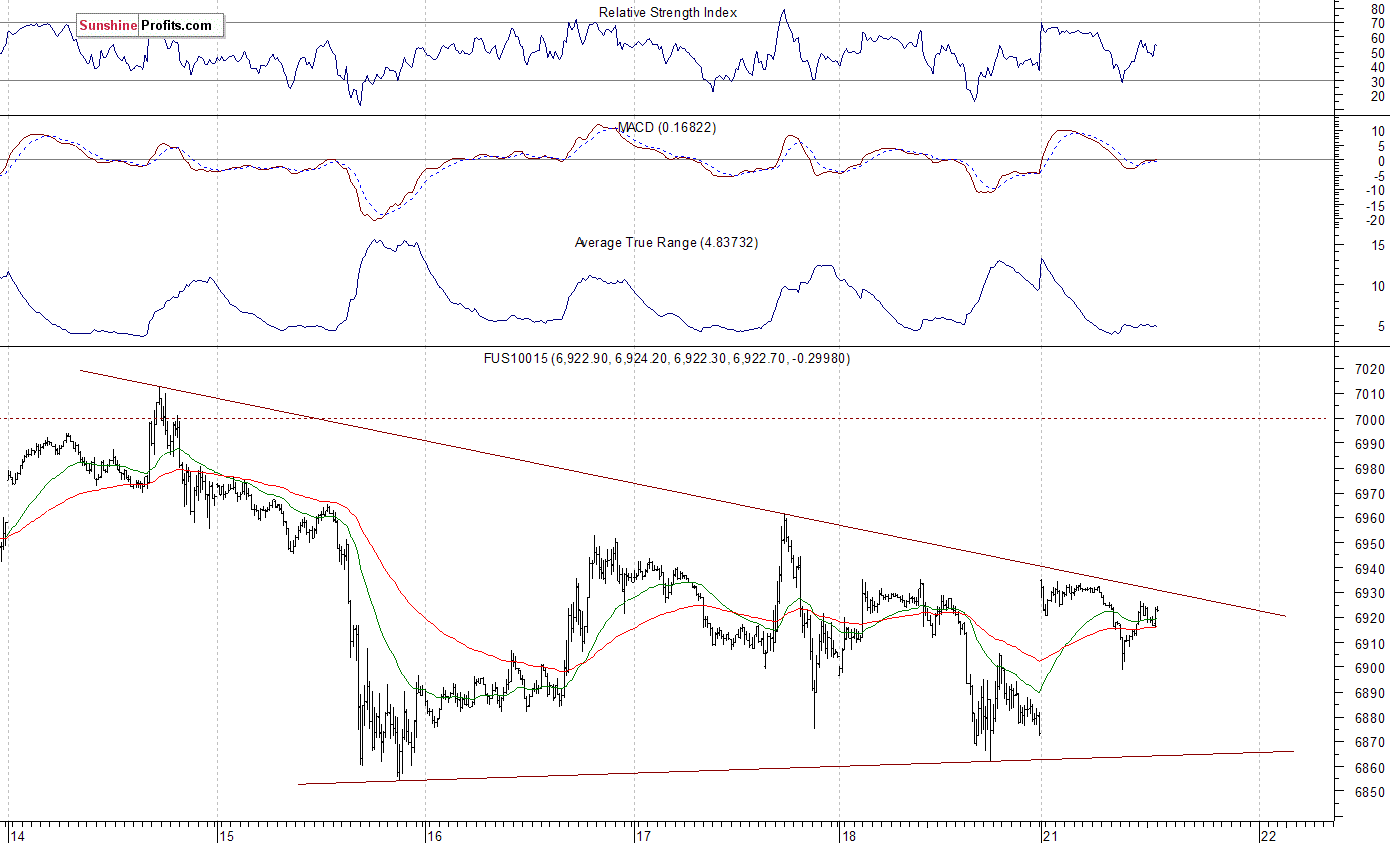
The technology Nasdaq 100 futures contract follows a similar path, as it trades within an intraday consolidation after opening higher vs. its Friday's closing price. The market fluctuates after bouncing off 7,000 mark a week ago. Is this just downward correction or a topping pattern ahead of downward reversal? It's hard to say. However, tech stocks remain relatively close to their all-time highs. The nearest important support level of the Nasdaq 100 futures contract is at around 6,900, and the next support level is at 6,850-6,870, marked by local lows. On the other hand, resistance level remains at 6,940-6,960, among others. The Nasdaq futures contract extends its short-term triangle pattern, as the 15-minute chart shows:
Apple, Amazon Still Going Sideways
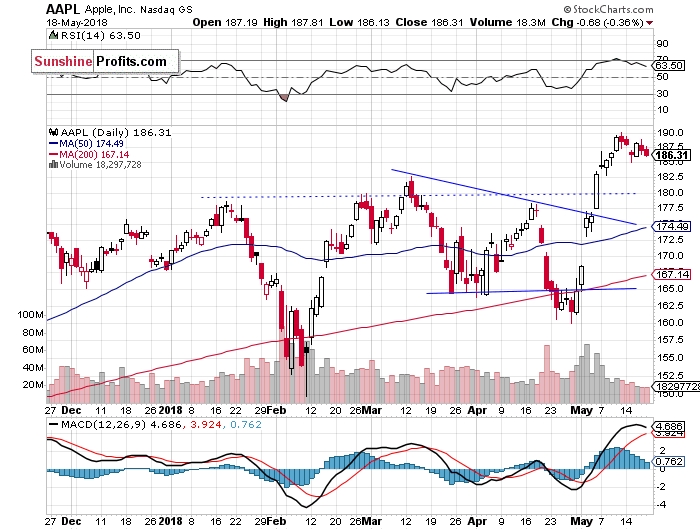
Let's take a look at Apple, Inc. stock (AAPL) daily chart (chart courtesy of StockCharts). It reached new record high more than a week ago on Friday, as it extended its short-term uptrend. The price bounced off resistance level of around $190-200 and since then, it trades within a consolidation. Is this a topping pattern? There have been no confirmed negative signals so far:
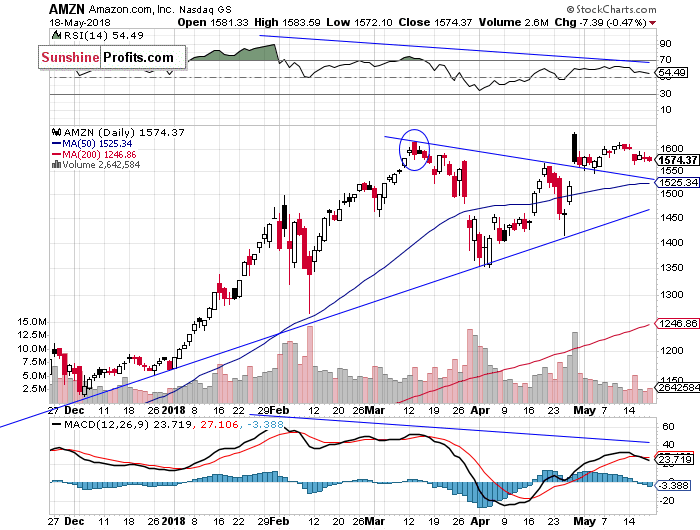
Now let's take a look at Amazon.com, Inc. stock (AMZN) daily chart. The price reached new record high in late April, as investors reacted to the better-than-expected quarterly earnings release. Then, on the same trading day, it sold off below $1,600. Was this a downward reversal or just correction following breakout higher? The recent price action looked pretty bullish, as price got back closer to all-time high level. However, the stock retraced some of its recent advance on last week's Tuesday. We may see some more short-term uncertainty following late April rally:
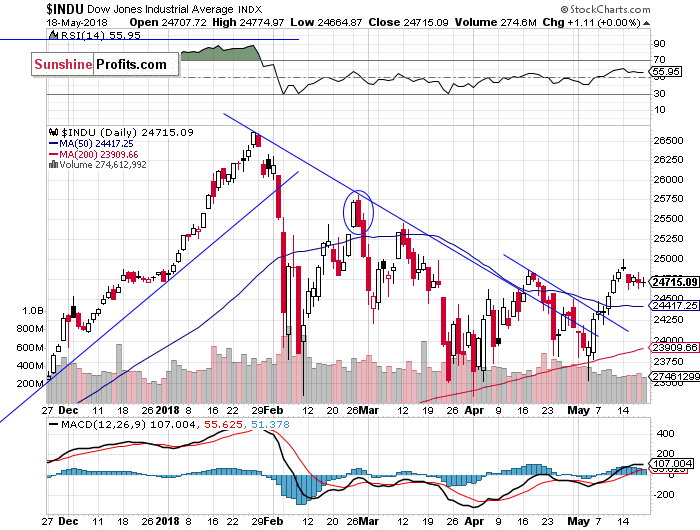
Dow Jones Remains Slightly Below 25,000 Mark
The Dow Jones Industrial Average broke above its medium-term downward trend line recently. Then it continued higher above a few-week-long downward trend line. The blue-chip index bounced off resistance level of 25,000 a week ago, and then it retraced some of its recent advance. It continued to fluctuate relatively close to resistance level. Topping pattern or just flat correction? It looks like a correction:
The broad stock market reached the highest since March 21 on Monday a week ago, following S&P 500 index breakout above 2,700 mark, but it retraced some of its recent advance on the next day. Is this a new downtrend or just downward correction? For now, it looks like a correction within an uptrend. The market extends its medium-term fluctuations. Just like we wrote in our several Stocks Trading Alerts, the early February sell-off set the negative tone for weeks or months to come.
Concluding, the S&P 500 index is expected to open higher today, as investors react positively to weekend's news about the U.S. - China trade talks. However, there are some close resistance levels ahead, and we may see more short-term uncertainty. There have been no confirmed negative signals so far. It still looks like some relatively flat correction within an uptrend.
Disclosure: None.


