
China, U.S. Economies Show Signs Of Growth
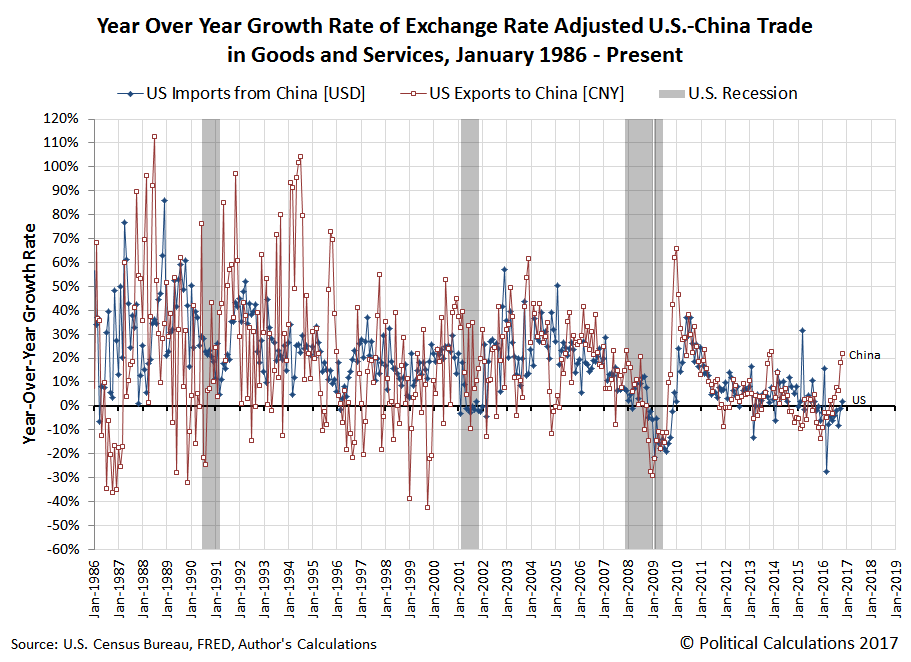
For the first time since September 2015, the year over year growth rate of the total value of the goods that the U.S. imports from China has turned positive (outside of seasonal anomalies related to the variable timing of China's week long Spring Festival holiday from year to year), which indicates that the U.S. economy's long dry spell of lackluster if not outright negative growth may finally be ending. At the same time, the growth rate of the value of goods that the U.S. exports to China spiked up to values not seen since the fourth quarter of 2013, which suggests that the U.S.' GDP for the fourth quarter of 2016 will get a boost from them.
Focusing on the U.S.' surge in exports to China, we once again recognize the impact of 2016's bumper crop in soybeans, which has resulted in record volumes of the year's crop being purchased by Chinese interests. The following chart updates the previous version that we posted over a month ago with the most recent data (through November 2016).
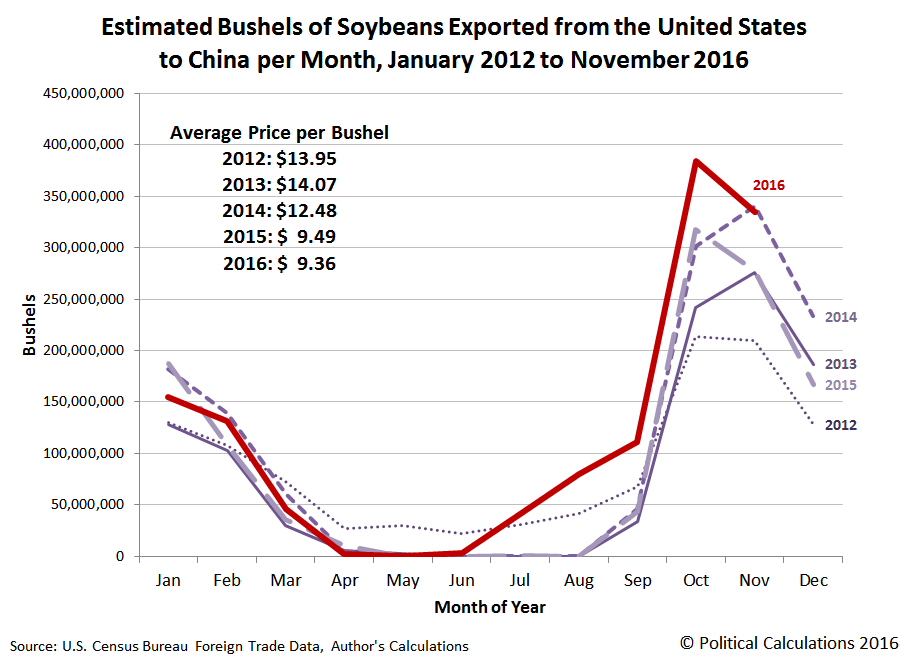
Like for 2016-Q3, 2016's continuing elevated volumes for soybean exports compared to previous years suggest that soybeans will be responsible for a significant, positive contribution to U.S. GDP in 2016-Q4.
Data Sources
Board of Governors of the Federal Reserve System. China / U.S. Foreign Exchange Rate. G.5 Foreign Exchange Rates. Accessed 15 January 2017.
U.S. Census Bureau. Trade in Goods with China. Accessed 15 January 2017.
Disclosure: None.


