
Chicago Fed Nat’l Activity Index: Oct 2014 Preview
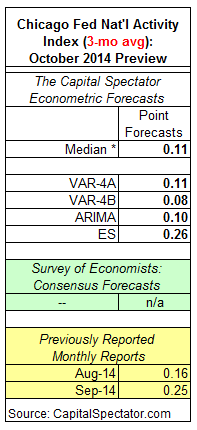
The three-month average of the Chicago Fed National Activity Index (CFNAI) is expected to decelerate to a +0.11 reading in the October update that’s scheduled for release on Monday (Nov. 24), based on The Capital Spectator’s median econometric point forecast for several econometric estimates. The projection is moderately below the +0.25 value for September, which reflected above-average economic growth for the US relative to the historical trend. Only values below -0.70 indicate an “increasing likelihood” that a recession has started, according to guidelines from the Chicago Fed. Using today’s estimate for October as a guide, CFNAI’s three-month average is expected to remain at a level that’s historically associated with growth at an above-trend pace.
Here’s a closer look at the numbers, followed by brief definitions of the methodologies behind The Capital Spectator’s projections that are used to calculate the median forecast:
VAR-4A: A vector autoregression model that analyzes four economic time series to project the Chicago Fed National Activity Index: the Capital Spectator’s Economic Trend & Momentum Indexes, the Philadelphia Fed US Leading Indicator, and the Philadelphia Fed US Coincident Economic Activity Indicator. VAR analyzes the interdependent relationships of these series with CFNAI through history. The forecasts are run in R with the “vars” package.
VAR-4B: A vector autoregression model that analyzes four economic time series to project the Chicago Fed National Activity Index: US private payrolls, real personal income less current transfer receipts, real personal consumption expenditures, and industrial production. VAR analyzes the interdependent relationships of these series with CFNAI through history. The forecasts are run in R with the “vars” package.
ARIMA: An autoregressive integrated moving average model that analyzes the historical record of the Chicago Fed National Activity Index in R via the “forecast”package.
ES: An exponential smoothing model that analyzes the historical record of the Chicago Fed National Activity Index in R via the “forecast” package.
Disclosure: None.


