
Chart Of The Week: GSG Outperforms Gold
Back in mid-April the chart of the week asked if commodities had made a bottom. The answer was maybe in that the short and intermediate term had turned positive but the long term monthly chart had yet to trigger a buy signal. That hasn’t changed by the way. If you read my Global Asset Allocation updates you know I added gold to the portfolio last summer in response to a peak in real interest rates and a shift in momentum from stocks to gold. Early this year, our monthly momentum indicator gave a buy signal for gold.
What seems to have slipped under the radar is that general commodities have lately been outperforming gold. Actually that started way back in February and continues today. Indeed, even as gold has been taking a hit the last few days from the “hawkish” Fed minutes – hawkish until the S&P sports an 1800 handle anyway – GSG, the GSCI ETF, has performed much better – the trend is intact.
(Click on image to enlarge)
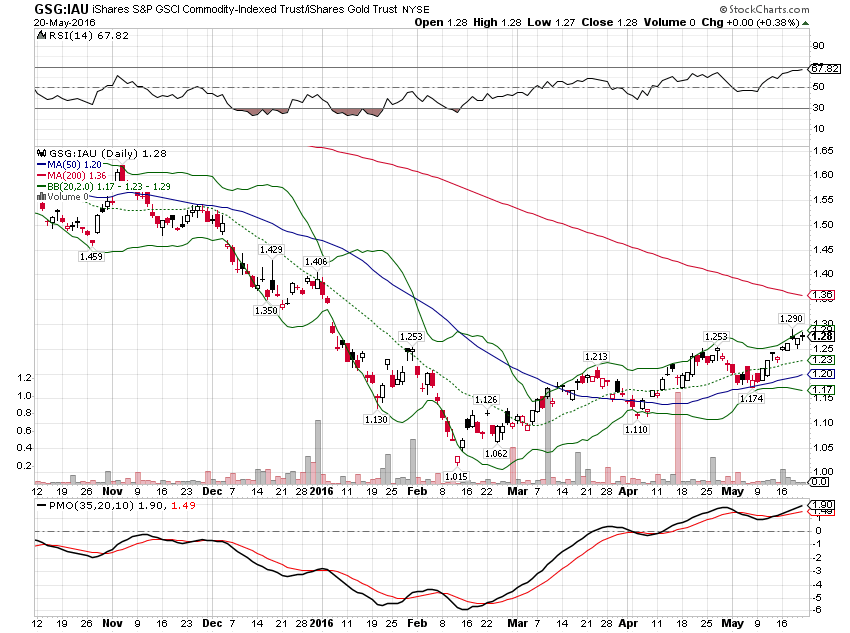
Obviously, it is a short term trend and subject to reversal. We saw a similar stretch of outperformance in early 2015 that was ultimately reversed in drastic fashion.
(Click on image to enlarge)
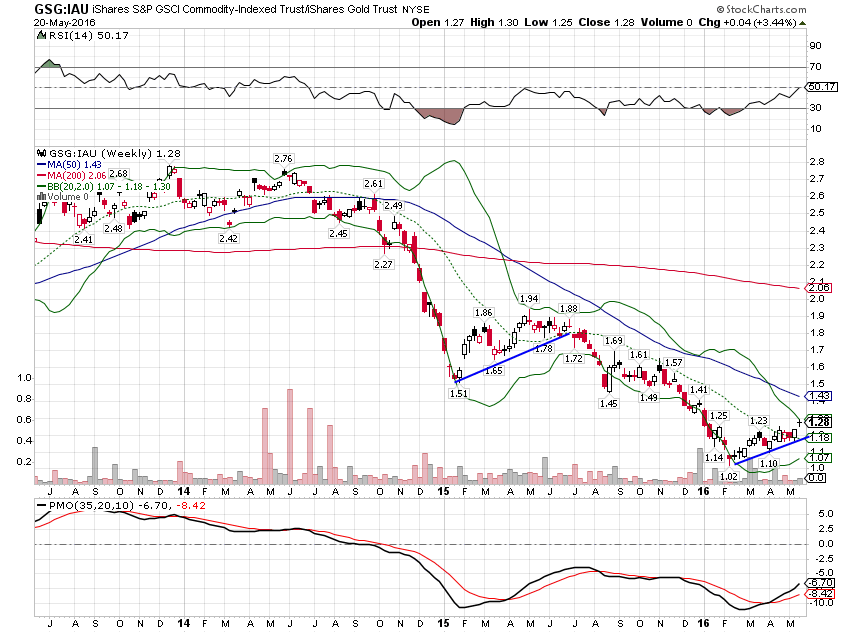
I don’t know if the outperformance will continue – GSG has outperformed IAU by 18% over the last 3 months – but it bears watching. It might mean the global economy is in better shape than we think.
Disclosure: This material has been distributed for ...
more

