
Chart Of The Day- Facebook
Take a look at Facebook here.
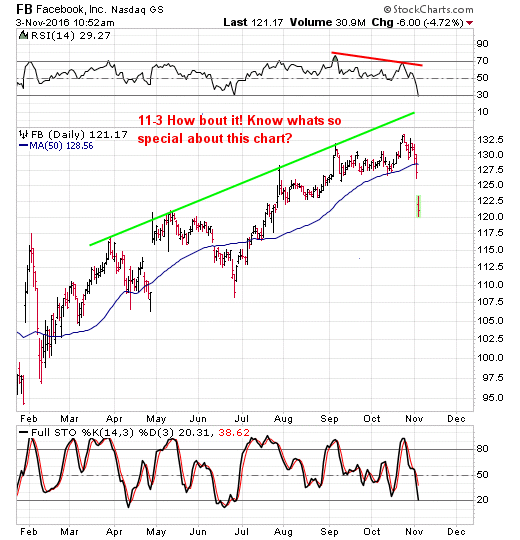
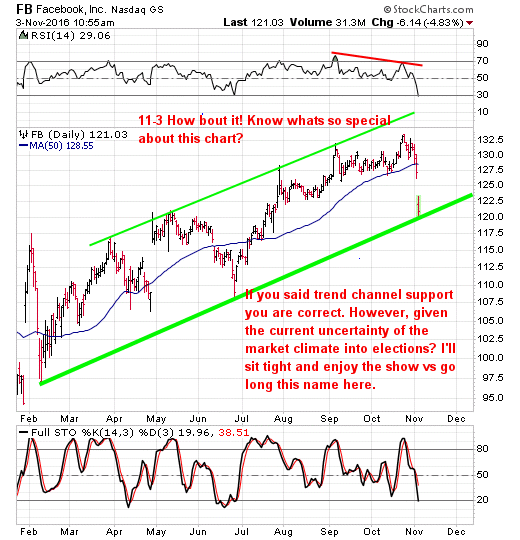
While this is trend channel support zone as well as near the 200 day moving average (not shown) which in normal times tends to act as a good place for a long side entry, understand we are smack dab into that world's greatest reality show season finale right around the corner. Therefore we'll pass on this support zone to use as a long side entry for the time being. Now should the stock decide to work higher from here anyway?
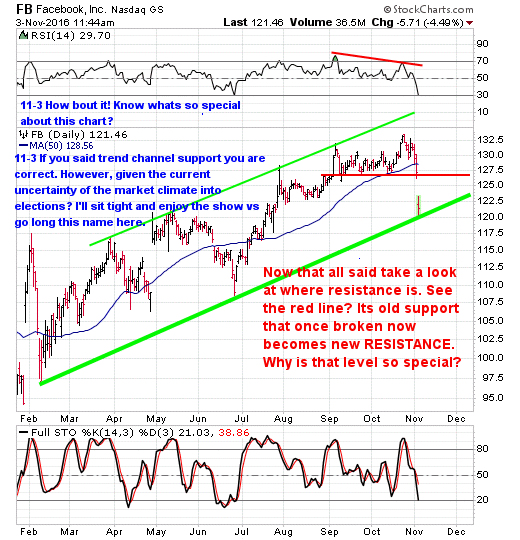
Why is the $127 resistance zone so special? Take a look at the chart below.
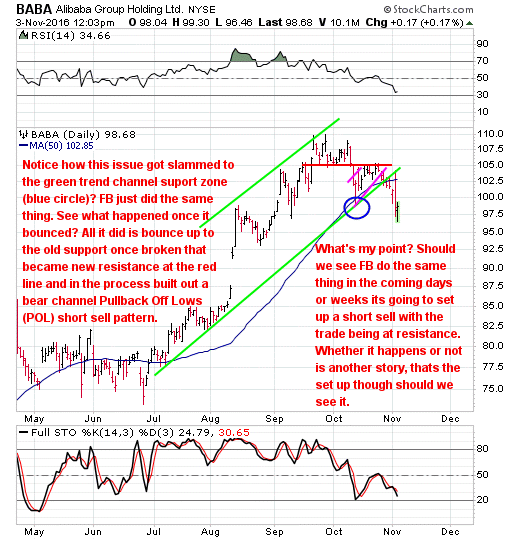
That all said, even if at some point in the coming weeks FB bounces there is a pretty serious amount of resistance at the $127 zone which could set up a short sell. Let's not put the cart in front of the horse just yet, though, we need to see IF it gets there first.
Hope this helps.
Disclosure: None.


