
Capitulation Or Acceleration? – Weekly Market Outlook
Stocks toyed with the idea two weeks ago, but pulled the trigger last week. What's that? A significant stumble. After the bullish momentum slowed the first full week back after Thanksgiving, it reversed – in spades. The S&P 500's (SPY) (SPX) 3.5% pullback last week was actually the worst single calendar-week performance since August of 2011.
Ironically, the sheer size of the selloff may also be the best thing going for the market this week, as it may inspire a short-term bounce. The market also halted Friday's pullback at a spot where the bulls have a good chance at making a successful stand. The details are discussed below, following an inspection of last week's and this week's key economic numbers.
Economic Data
Economic data was relatively sparse last week. In fact, the only heavy-hitting information we got was November's retail sales growth. It was encouraging. Last month's overall retail consumption was up 0.7%, and even when taking automobiles out of the picture, November's retail sales were up 0.5%. Both figures were considerably better than expected. Perhaps more important at this time, as the plot of the broad retail spending trend below continues to suggest, the consumer is feeling just fine – spending remains healthy. [The month-to-month volatility is normal.]
Retail Spending Chart
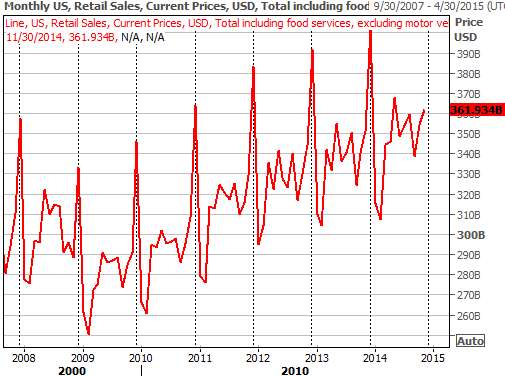
Source: Thomson Reuters Eikon
It's not as important as the strength in retail spending for November, but it is likely to be an omen of what to expect when we hear this week's consumer inflation data.
On Friday, the Bureau of Labor Statistics reported another slide in producer costs. The Producer Price Index fell 0.2% overall, and was flat on a core (ex-food and energy) basis. The annualized PPI rate fell from October's 1.5% to 1.4%. Last month's consumer price index data will be announced on Wednesday, and should be similar tepid. The problem is, the annualized consumer inflation rate now stands at a rather low 1.66%. There's not much room for even-weaker inflation before structural problems surface for the economy.
Consumer Inflation Trends Chart
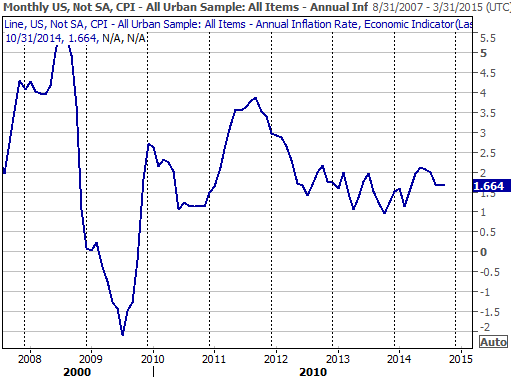
Source: Thomson Reuters Eikon
Everything else is on the following table/calendar:
Economic Calendar
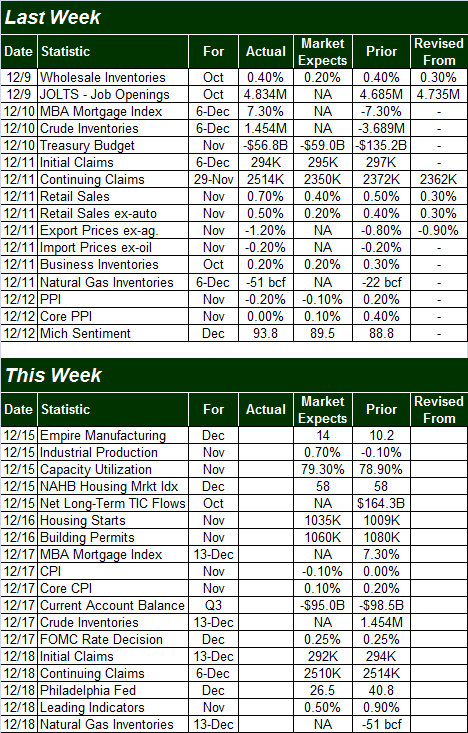
Source: Briefing.com
The coming week has a couple of potential market-moving catalysts in the queue. One of them is Tuesday's housing starts and building permits figures for November. These indications of real estate and construction strength have been just so-so of late. Any deviation from the recent mode of mediocrity could rattle the market… for better or worse.
Housing Starts and Building Permits Chart
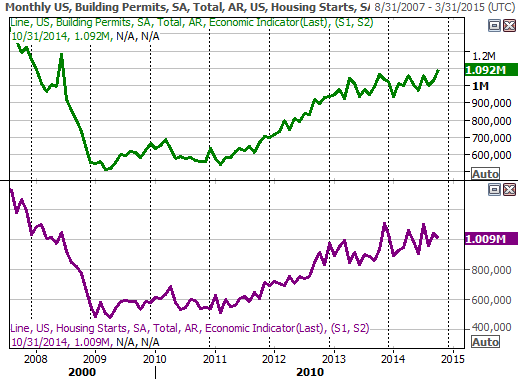
Source: Thomson Reuters Eikon
The Federal Reserve is also going to unveil its latest thoughts and planned changes to the country's economic throttle on Wednesday, though it's unlikely we'll see any actual changes to interest rates just yet. All the same, the language the Fed uses to describe our current situation has been just as market-moving as any changes (or lack thereof) to the federal funds rate of 0.25%.
Wednesday is also the day we'll hear about November's consumer inflation rate.
Stock Market Index Analysis
As was noted above, the S&P 500 fell 3.5% last week… the biggest weekly tumble since 2011. In retrospect, the rollover can't be entirely surprising. After all, the index stalled at 2075 the week before. The question is, now what? Is there any chance the market could turn the ship around before taking on any more water? As a matter of fact, there is.
While there are a stark similarities between what happened last week and how the early-October pullback got started, this one has unfurled at a much faster pace than the October meltdown did. In fact, the selling was so steep, it may have flushed out all the overhang and would-be profit-taking that could have gotten in the market's way, clearing the decks this week for a big rebound rally.
In other words, there are some aspects of last week's action that look capitulatory. The fact that the S&P 500 only had to brush the 50-day moving average line (purple) on Friday to stop falling further bolsters the bullish argument.
S&P 500 & VIX – Daily Chart
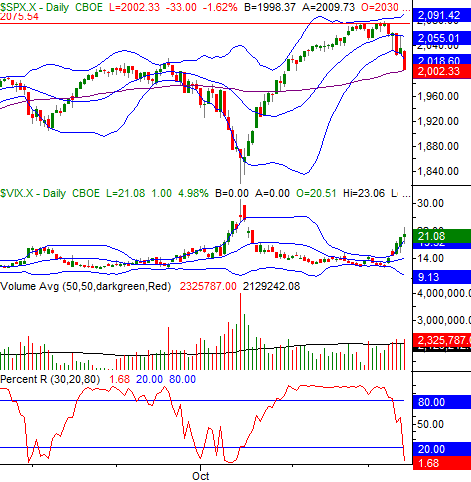
Chart created with TradeStation
On the flipside, the bearish arguments are a little better, and slightly more numerous.
First and foremost, Friday's action lacked the volume spike needed to call it a capitulation. Usually bottoms are made with a huge flushout of sellers immediately followed by a huge inflow of buyers. See the October 15th low as an example.
Simultaneously, though we can't assume every twist and turn the market makes is evidence of a new trend, from a momentum perspective, the trend is indeed bearish now. The PercentR reading has flipped into the sub-20, bearish area, which is an indication of a move into a bearish situation. Granted, previous moves below 20 for the PercentR have been short-lived for some time now, but until the PercentR line upper 26-week Bollinger band. The upper Bollinger band has marked most of the market lows pretty well since mid-2013.
S&P 500 & VIX – Weekly Chart
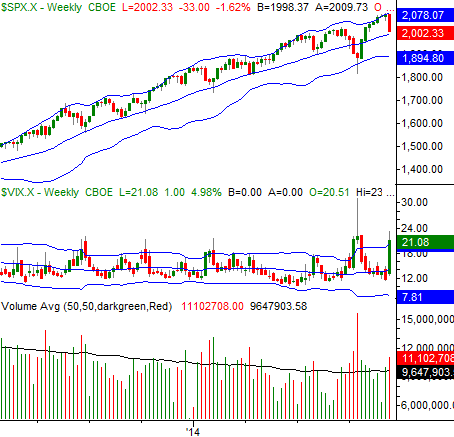
Chart created with TradeStation
A bullish start this week doesn't inherently mean the market's going to race to new highs. The downtrend is still in place until and unless the 20-day moving average line at 2055 is cleared. It's still entirely possible we could see a dead-cat bounce early this week fizzle out before the key resistance line at 2055 is hurdled, and then allow the S&P 500 slide under 2002 — let's call it 2000 — to open the selling floodgates.
This week, almost needless to say, is a pivotal one… at least for the near term. The longer-term trend is still a bullish one for now.
If we roll over bearishly one out of the gate, then the odds of a significant pullback rise exponentially as there will be few potential floors left in place to stop the bleeding. The support level to watch at this point is 2002, which is right where the S&P 500 closed last week. In the same vein, if the CBOE Volatility Index (VIX) (VXX) makes a close above last week's close of 21.08 this week, that may help but a bearish trend in place that's not easily stoppable.
Trade Well,
Price Headley
Disclosure: None.


