
Canadian Dollar Enjoys GDP, But Not NAFTA
- Fear of excluding Canada from NAFTA and the Fed sent the loonie higher, but GDP helped it recover.
- Friday’s jobs reports from both countries stand out in the first week of October.
- The technical picture is mixed for the USD/CAD.
This was the week: Is NAFTA slipping away from Canada + Fed hike
US President Donald Trump continued criticizing Canada on its trade practices. More importantly, the US deadline for reaching a NAFTA deal with Canada is about to expire and they intend to move forward with a bilateral agreement with Mexico, excluding Canada. The goal is to ratify the deal before Lopez-Obrador becomes Mexico’s President on December 1st and before the current term of the US Congress ends.
The US still plans to draft the text in a manner that will allow Canada to join later. Nevertheless, the American announcements weighed on the Canadian Dollar.
Canada’s GDP rose by 0.2% MoM in July after remaining flat in June. The small beat reversed the trend and pushed the C$ higher.
The Raw Materials Price Index (RMPI) plunged by 4.6%.Bank of Canada Governor Stephen Poloz reiterated the Bank’s stance to raise rates at a gradual pace. He also expressed optimism about NAFTA but said that Canada’s reliance on the US has recently dropped.
The US Federal Reserve raised interest rates as expected and also maintained the projections for four more hikes until the end of 2019. The FOMC Statement did not include the words “accommodative policy” and this weighed on the greenback initially. However, Fed Chair Jerome Powell stressed that the Fed’s policy has not changed and the US Dollar advanced.
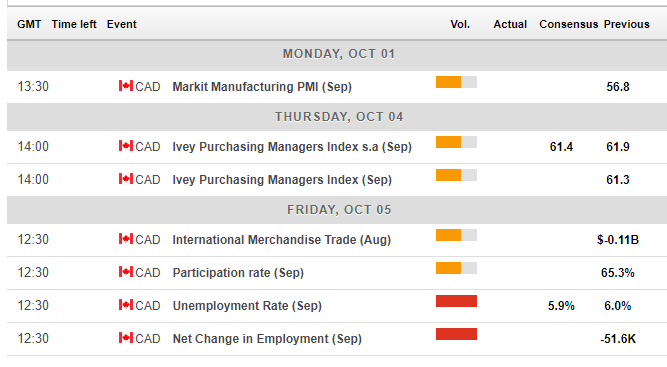
Canadian events: Jobs report high on the agenda
Markit’s manufacturing PMI on Monday and the Richard Ivey’s Purchasing Managers’ Index on Thursday may have some impact on the loonie, but the primary event is only on Friday. Canada reported a considerable loss of jobs in August: no less than 51.4K. A bounce is likely now. The Unemployment Rate rose to 6%, concerning some watchers and it is now projected to drop back down.
Ths employment report is the last one before the all-important rate decision in October. The BOC is on course to raise rates, assuming no unexpected disaster.
NAFTA developments will likely continue to rock the loonie in the upcoming week. After a few weeks on the backburner, the topic is on top again and is unlikely to move out of the limelight anytime soon.
Here is the Canadian calendar for this week:
(Click on image to enlarge)
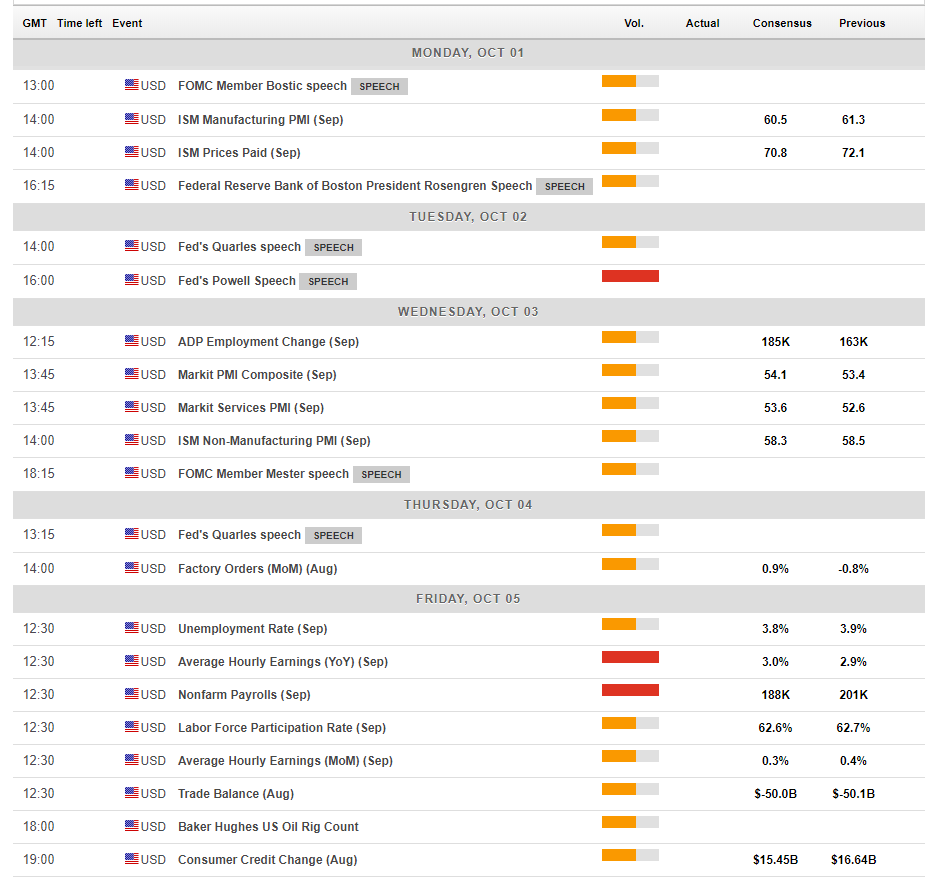
US events: NFP with a full preparation
The first week of Q1 is packed with events. The ISM Manufacturing PMI provides the first hint for the Non-Farm Payrolls on Friday. The forward-looking gauge shot up in August and may slide now, albeit remaining at high ground.
Wednesday is a busy day with the ADP Non-Farm Payrolls. Private sector jobs rose by only 163K in August according to the payrolls firm. A better outcome is forecast for Friday. The ISM Non-Manufacturing PMI and its employment component also serve as interesting insights for the US Dollar. In addition, Fed Chair Jerome Powell will make another public appearance. However, it will be his third speech in a week and it is hard to see him diverging from the recent messages.
The most significant event of the week is on Friday. The Non-Farm Payrolls report was upbeat in August, showing a gain of 201K and more importantly, wages increased by 0.4% MoM and 2.9% YoY. Annual wage growth is projected to increase to 3% in the publication for September. The headline figure is estimated to be a tad lower this time.
With a month to go towards the mid-term elections, political developments will likely have a growing impact on markets. Trade relations with China are off the headlines for now, but Trump still intends to push forward with additional duties.
Here are the critical American events from the forex calendar:
(Click on image to enlarge)
USD/CAD Technical Analysis
The USD/CAD is still trading around the downtrend resistance line that is part of the channel. However, it failed to conquer the 50-day Simple Moving Average. Momentum points to the downside. The Relative Strength Index is balanced.
1.2970 served as support in early August and early September. Further down, we see the double bottom of 1.2880 which provided support in late August and also in mid-September. Below, we see 1.2820 that cushioned the pair in May. 1.2730 is below.
1.3060 capped the pair in mid-August and provided support back in July. 1.3100 was a level of support when the USD/CAD traded on high ground in early September. 1.3175 held the pair down in August and 1.3220 was the peak in early September.
(Click on image to enlarge)
-636737370450466416.png)
Disclaimer: Foreign exchange (Forex) trading carries a high level of risk and may not be suitable for all investors. The risk grows as the leverage is higher. Investment objectives, risk appetite and ...
more

