Can You Find Quality Companies In Every Sector?
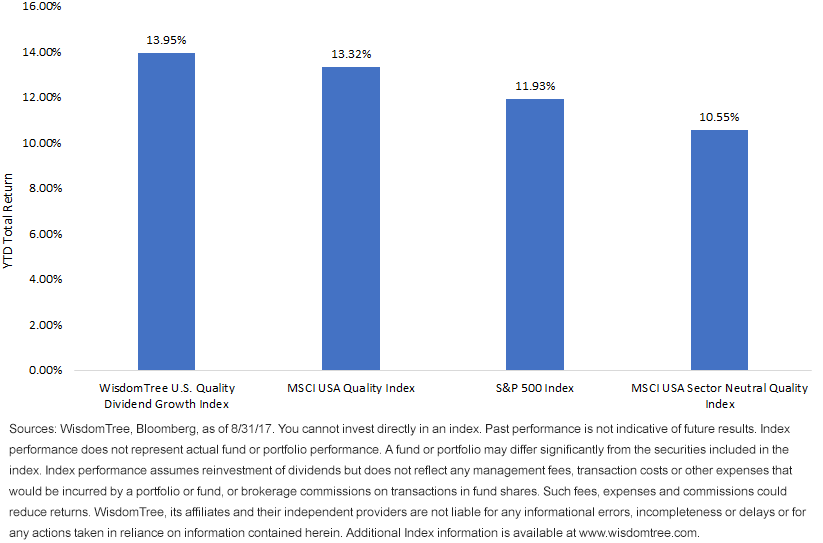
In what may be the late stages of a bull market, many investors have flocked to quality. As a factor that may do well on the tail end of rising rates, quality can provide investors with the comfort that if markets turn, at least their money will be in companies with strong balance sheets that can potentially weather the storm better than others. This is one reason we believe the WisdomTree U.S. Quality Dividend Growth Index, a strategy meant to measure dividend growth and the quality factor among large caps in the U.S. market, has bested the S&P 500 Index by more than 200 basis points (bps) year-to-date through August 31, 2017.
(Click on image to enlarge)

Yet, we noticed that not all indexes are taking advantage of the quality trend year-to-date. In fact, the MSCI USA Sector Neutral Quality Index is lagging the S&P 500 by almost 150 bps and lagging its non-sector-neutral counterpart by almost twice that, despite the positive environment for the factor it is designed to capture. We decided to dig a little deeper to pinpoint the differences among these Indexes and to ascertain why they might be capturing recent market trends so differently.
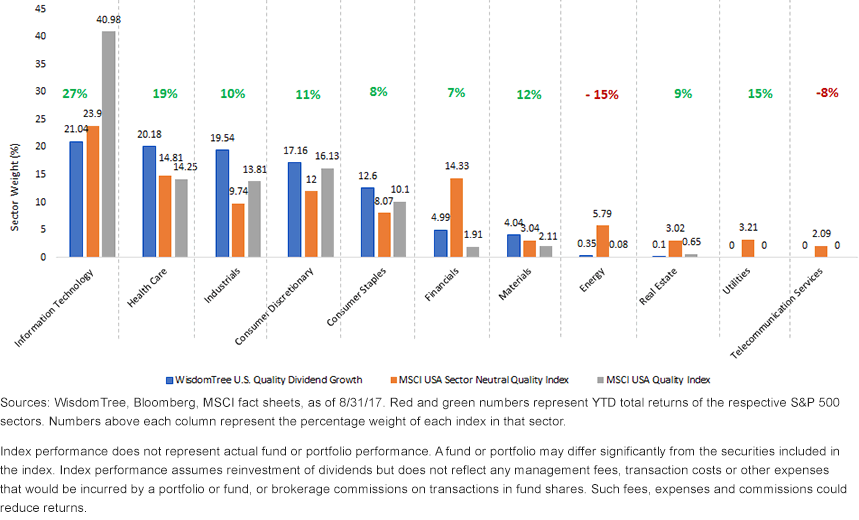
In the below chart, the numbers in red and green represent the total return for each S&P 500 sector year-to-date. The data above each column is the percentage weight each index had in those respective sectors as of August 31, 2017.
YTD Total Returns of S&P 500 Sectors as of 8/31/2017
(Click on image to enlarge)

One thing that stood out to us about the WisdomTree U.S. Quality Dividend Growth Index and the MSCI USA Quality Index is how they seek out quality, wherever they may find it. That is what leads the Indexes to have almost 0% exposure to the energy sector and no exposure to telecommunications, the only two S&P 500 sectors that are negative year-to-date. The MSCI USA Sector Neutral Quality Index, however, forces itself to be sector neutral, picking “quality” companies in sectors that the WisdomTree Index and MSCI USA Quality Index avoided altogether.
The MSCI USA Quality Index, while performing well, has still lagged the WisdomTree U.S. Quality Dividend Growth Index despite an almost 20% over-weight to the best performing sector in the S&P 500: information technology. The WT Index, which caps individual sector bets at 20% during the annual rebalance, found quality elsewhere and distributed weight to sectors such as health care, allowing it to keep pace and even outperform the MSCI USA Quality Index without running the same sector risk should information technology take a turn for the worst.
Conclusion
With quality currently outperforming, it’s important to know what makes up your index. In the case of the WisdomTree U.S. Quality Dividend Growth Index, we believe it has done its job of capturing dividend growth and quality while avoiding sectors that don’t possess it and not weighting too heavily those sectors that may have a lot of it. On May 22, 2013, WisdomTree launched the WisdomTree U.S. Quality Dividend Growth Fund (DGRW), an exchange-traded fund that seeks to track this Index.
Disclaimer: Investors should carefully consider the investment objectives, risks, charges and expenses of the Funds before investing. U.S. investors only: To obtain a prospectus containing this ...
more


