
Bulls Gather Conviction, Led By Tech, As Uncertainties Are Lifted
Stocks continue to hold up well, encouraged by improving global fundamentals and a solid Q1 corporate earnings season. However, at the moment most of the major US market indices are struggling at key psychological levels of technical resistance that have held before, including Dow at 21,000, S&P 500 at 2,400, and Russell 2000 at 1,400. Only the Tech-heavy NASDAQ seems utterly undeterred by the 6,100 level, after having no problem blasting through the 6,000 level with ease last month and setting record highs almost daily. Perhaps the supreme strength in Tech will be able to lead the broader market through this tough resistance level. Every time it appears stocks are on the verge of a major correction, they catch a bid at an important technical support level. In other words, cautious optimism remains the MO of investors – despite weighty geopolitical risks and, here at home, furious political fighting at a level of viciousness I didn’t think possible in the U.S.
There is simply no denying the building momentum in broad global economic expansion, and any success in implementing domestic fiscal stimulus will just add even more fuel to this burgeoning fire. That’s not to say that we won’t see a nasty selloff at some point this year, but I think such an occurrence would have a news-driven (or Black Swan) trigger, and likely would ultimately serve as a broad-based buying opportunity.
In this periodic update, I give my view of the current market environment, offer a technical analysis of the S&P 500 chart, review Sabrient’s weekly fundamentals-based SectorCast rankings of the ten U.S. business sectors, and then offer up some actionable ETF trading ideas. Overall, our sector rankings still look bullish, while the sector rotation model has returned to a bullish bias even though stocks now struggle at strong psychological resistance levels.
Market overview:
Q1 earnings season has been solid, no matter what caveats you hear from the naysayers seeking airtime. Over 80% of the S&P 500 companies have reported, with 75% meeting or beating estimates, and an average of 13.5% year-over-year EPS growth. Apple (AAPL) was one that failed to impress and yet the stock is still hitting new highs, pushing its market capitalization past $800 billion. Some new analyst price targets are suggesting it will soon reach $1 trillion market cap with the release of the iPhone 8.
Of course, Technology has been by far the top performing sector, up about +18% year to date. For example, NVIDIA (NVDA) is up about 25% just over the past couple of days after blowing away earnings estimates. And IPO activity is heating up, with some observers making predictions for this year reaching the level of the 1999 internet bubble heyday. It should come as no surprise that the NASDAQ 100 (+16.7% versus S&P 500 +7.0% YTD through Thursday) has been the powerhouse index when you consider that just five top-performing stocks – Apple (AAPL, +32.9%), Facebook (FB, +30.4%), Amazon.com (AMZN, +26.4%), Alphabet Google (GOOGL, +20.6%), and Microsoft (MSFT, +10.2%) – make up 42% of the Nasdaq 100 but only 13% of the S&P 500.
However, I don’t expect this trend of investor capital flowing strongly into these and other blue chip bellwethers continuing much longer, as their valuations – and by extension the valuations of the major cap-weighted market indexes – have become extended and cannot rely upon further multiple expansion much longer. Instead, I expect the market will resume its trend toward greater breadth and lower correlations (Convergex reports that average S&P 500 sector correlations are averaging under 60% YTD). Old-fashioned fundamentals (like top and bottom-line growth) once again matter to investors, creating winners and losers rather than all boats lifted in a highly correlated rising tide. I expect many of the high-P/E blue chips will ultimately underperform nimble, well-positioned, low-PEG small and mid caps.
On a related topic, the passive vs. active war of words continues, with DoubleLine Capital CEO Jeffrey Gundlach jumping into the fray last Monday at the Sohn Investment Conference. He believes that this period of massive capital flows away from active managers and into the cap-weighted passive indexes has run its course, and the stage is set for stock-pickers to outperform once again, with a preference for emerging markets over large-cap US. In fact, he recommended a pair trade of buying long the iShares MSCI Emerging Markets ETF (EEM) and shorting the SPDR S&P 500 Trust (SPY).
In any case, looking ahead, the climate seems good for equities. Along with a solid Q1 earnings season showing solid EPS growth, we have a strong labor market with official unemployment at 4.4%, continued GDP growth (both at home and abroad), optimism for the EU remaining intact (and perhaps becoming more business-friendly), cheap commodity prices, persistently low inflation and interest rates, and expanding M2 Money Supply. The risk of an imminent recession in any of the developed markets appears to be low, which in turn bodes well for emerging markets.
About the only macroeconomic threats to this outlook are: 1) the Fed’s eventual balance sheet reduction (i.e., sale of accumulated Treasuries and asset-backed securities during its QE fling), as part of its effort to normalize both the size of its balance sheet and the longer end of the yield curve, and 2) perhaps more ominously, China’s extreme debt situation leading to a bursting of their “credit bubble,” another big crash in oil and commodity prices, and the resultant impact on the Energy sector, high yield bond market, and emerging markets. However, as for the Fed’s balance sheet, there are some good reasons why it may need to maintain a larger balance sheet than it has historically, such as an increased foreign demand for U.S. dollars, which the Fed itself estimates will require dollar circulation to grow to $2.5 trillion or more over the next decade. And as for China, the country’s leadership has consistently demonstrated an amazing ability to keep kicking the can down the road with effective interventions.
The 10-year Treasury closed Thursday at 2.40% while the 30-year closed at 3.04%. On the short end of the yield curve, the 2-year closed at 1.34% and the 5-year at 1.93%. The spread between the 10-year and 2-year is 106 bps, while the spread between the 30-year and 5-year is now 111 bps. Movement on these spreads has been minimal. CME fed funds futures now place the odds of the next rate hike in June at 83%, and by December there is a 56% chance of another one.
The CBOE Market Volatility Index (VIX), aka fear gauge, closed Thursday at 10.60, after hitting a new low of 9.56 on Tuesday, and has set a new record for consecutive days closing under 11. Notably, 1993 was the last time VIX was that low. Some observers say that investors are simply not worried about a market selloff, given the strong global fundamentals, while others see the VIX as artificially low due to a changing market structure and is setting up stocks for “carnage” when it inevitably spikes higher.
Providing an added boost to investor confidence (and complacency) is the realization that some of the main geopolitical risks from just a few weeks ago appear to have moderated. With China apparently unwilling to unconditionally support North Korea’s saber-rattling, many believe the threat of war is greatly lessened. In addition, the risk of Frexit is now behind us, replaced instead by the promise of more business-friendly policies in France – and perhaps spreading to the rest of the EU and beyond, along with a gradual global normalization in interest rates, as the temptation to devalue (in a “race to the bottom”) is lessened. We are already seeing solid PMI reports in many developed markets.
Brian Wesbury of First Trust Advisors put out a market update last Monday in which he argued that “the pendulum” is swinging from left to right as the rest of the world follows our lead here in the U.S. toward more free-market capitalism, and less in the way of socialist policies like excessive taxation and regulation, big government programs, and forced “fairness” through wealth redistribution. He sees the French presidential election as the latest example.
I certainly agree that we as Americans must summon the wherewithal to reject the siren song of entitlements, which sound good in their benevolence but ultimately sap a society of its capital, and by extension its innovation and growth potential. For the past several years, the weight of government intrusion has simultaneously supported and stifled our economy, as it has in so many other economies around the world. Here at home, we witnessed a gridlocked government offer no fiscal stimulus and place the entire burden on Federal Reserve monetary stimulus, resulting in tepid economic growth, falling corporate capex, a profit recession, asset inflation without wage inflation, and a worsening wealth gap and income inequality leading to a greater reliance on entitlements, which predictably led to resentment and class warfare. And this has become a vicious cycle as the growing number of entitlement recipients become further disenfranchised and disillusioned, even as they keep hearing in the news about improving conditions and a growing stock market, and so they demand even more entitlements out of a sense of desperation and hopelessness. But loosening this noose on the free market offers real potential to improve the station of all Americans.
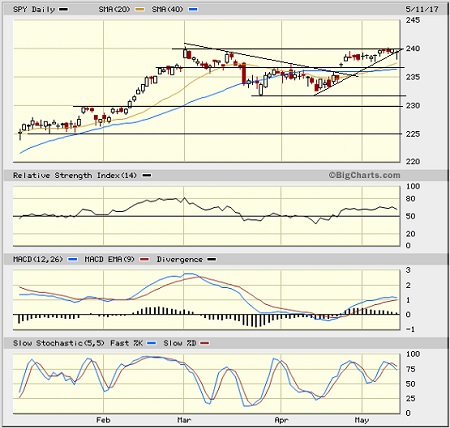
SPY chart review:
The SPY closed Thursday at 239.38 and has been bumping its head on the tough psychological resistance level of 240 (corresponding to about 2,400 on the S&P 500 index). It got the upside breakout that I predicted in my prior article on April 22, from a bullish ascending wedge (near 236) and neutral symmetrical triangle (apex at 235), and now it is forming a new bullish ascending wedge with 240 as the breakout level (with the same uptrend line as the previous ascending wedge. The 20-day simple moving average provided support intraday on Thursday and has crossed up through the 50-day. If SPY fails to break out and instead breaks down below the uptrend line, next support levels include the 236 level, a minor low in March around 232, the 100-day SMA now around 233, prior resistance-turned-support levels at 230 and 225, and the critical 200-day SMA (also at 225). As for oscillators like RSI, MACD, and Slow Stochastic, all three are looking like they are turning over and may need to cycle back down before price can take another run at a breakout. Overall, the technical picture looks pretty good for the medium term, although the near-term likely will bring more consolidation.
Latest sector rankings:
Relative sector rankings are based on our proprietary SectorCast model, which builds a composite profile of each of over 600 equity ETFs based on bottom-up aggregate scoring of the constituent stocks. The Outlook Score employs a forward-looking, fundamentals-based multifactor algorithm considering forward valuation, historical and projected earnings growth, the dynamics of Wall Street analysts’ consensus earnings estimates and recent revisions (up or down), quality and sustainability of reported earnings (forensic accounting), and various return ratios. It helps us predict relative performance over the next 1-3 months.
In addition, SectorCast computes a Bull Score and Bear Score for each ETF based on recent price behavior of the constituent stocks on particularly strong and weak market days. High Bull score indicates that stocks within the ETF recently have tended toward relative outperformance when the market is strong, while a high Bear score indicates that stocks within the ETF have tended to hold up relatively well (i.e., safe havens) when the market is weak.
Outlook score is forward-looking while Bull and Bear are backward-looking. As a group, these three scores can be helpful for positioning a portfolio for a given set of anticipated market conditions. Of course, each ETF holds a unique portfolio of stocks and position weights, so the sectors represented will score differently depending upon which set of ETFs is used. We use the iShares that represent the ten major U.S. business sectors: Financial (IYF), Technology (IYW), Industrial (IYJ), Healthcare (IYH), Consumer Goods (IYK), Consumer Services (IYC), Energy (IYE), Basic Materials (IYM), Telecommunications (IYZ), and Utilities (IDU). Whereas the Select Sector SPDRs only contain stocks from the S&P 500, I prefer the iShares for their larger universe and broader diversity.
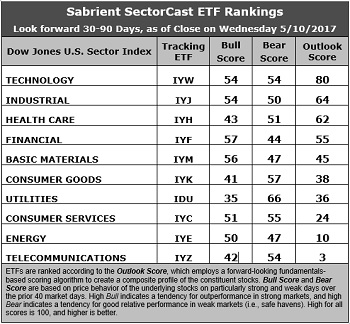
Here are some of my observations on this week’s scores:
1. Technology once again retains the top spot with an Outlook score of 80. In aggregate, stocks within the sector display among the best Wall Street sell-side analyst sentiment (i.e., net positive revisions to EPS estimates), the highest return ratios, a forward P/E of about 18.1x, a strong forward long-term EPS year-over-year growth rate of 13.6%, and a low forward PEG of 1.33 (ratio of forward P/E to forward EPS growth rate). In second this week is Industrial with an Outlook score of 64. It displays by far the best Wall Street sentiment this week and the best insider sentiment (net open market buying), although the forward P/E and PEG aren’t highly attractive. Healthcare comes in third and sports the lowest forward P/E of 16.1x. Rounding out the top five are Financial and Basic Materials, which is a very bullish ranking. Notably, analysts have been revising upwards across the board, and the only sector with net negative EPS revisions is Telecom.
2. Energy and Telecom remain in the bottom two with Outlook scores of 10 and 3, respectively. Telecom displays by far the weakest analyst sentiment (i.e., net negative earnings revisions), as well as the second highest forward P/E of 24.3x and the second highest (next to Utilities) forward PEG of 2.72. Energy has generally poor factor scores across the board, including the worst return ratios and the highest forward P/E of 25.4x, although it also boasts the highest year-over-year forward EPS growth rate (23%) on weak comps.
3. Looking at the Bull scores, Financial boasts the top score of 57, followed closely by Materials, as it has displayed relative strength on strong market days, while Utilities is the lowest at 35. The top-bottom spread is 22 points, which reflects low sector correlations on strong market days, which is favorable for stock picking. It is desirable in a healthy market to see low correlations reflected in a top-bottom spread of at least 20 points, which indicates that investors have clear preferences in the market segments and stocks they want to hold (rather than broad risk-on behavior).
4. Looking at the Bear scores, we find Utilities at the top with a score of 66, which means that stocks within this sector have been the preferred safe havens lately on weak market days. Financial is the lowest at 44, as investors have fled during market weakness. The top-bottom spread is 22 points, which reflects low sector correlations on weak market days. Ideally, certain sectors will hold up relatively well while others are selling off (rather than broad risk-off behavior), so it is desirable in a healthy market to see low correlations reflected in a top-bottom spread of at least 20 points.
5. Technology displays the best all-around combination of Outlook/Bull/Bear scores, while Telecom is the worst. Looking at just the Bull/Bear combination, Technology is the best, indicating superior relative performance (on average) in extreme market conditions (whether bullish or bearish), while Healthcare scores the worst, as investors have generally avoided the sector.
6. This week’s fundamentals-based Outlook rankings again look solidly bullish to me, given that the top five sectors are economically-sensitive or all-weather (Technology, Industrial, Healthcare, Financial, and Materials). Keep in mind, the Outlook Rank does not include timing, momentum, or relative strength factors, but rather reflects the consensus fundamental expectations at a given point in time for individual stocks, aggregated by sector.
ETF Trading Ideas:
Our Sector Rotation model, which appropriately weights Outlook, Bull, and Bear scores in accordance with the overall market’s prevailing trend (bullish, neutral, or defensive), displays a bullish bias and suggests holding Technology (IYW), Financial (IYF), and Industrial (IYJ), in that order. (Note: In this model, we consider the bias to be bullish from a rules-based trend-following standpoint when SPY rose above both its 50-day and 200-day simple moving averages.)
Besides iShares’ IYW, IYF, and IYJ, other highly-ranked ETFs in our SectorCast model (which scores over 600 US-listed equity ETFs) from the Technology, Financial, Industrial sectors include PowerShares Dynamic Semiconductors Portfolio (PSI), First Trust NASDAQ ABA Community Bank Index Fund (QABA), and PowerShares S&P Small Cap Materials Portfolio (PSCM).
If you prefer a neutral bias, the Sector Rotation model suggests holding Technology, Industrial, and Healthcare, in that order. On the other hand, if you are more comfortable with a defensive stance on the market, the model suggests holding Utilities, Technology, and Consumer Goods (Staples/Noncyclical), in that order.
By the way, an assortment of other unique ETFs that happen to score well (i.e., Outlook scores above 90) in our latest rankings include VanEck Vectors Mortgage REIT Income (MORT), PureFunds ISE Mobile Payments (IPAY), PureFunds Video Game Tech (GAMR), Arrow QVM Equity Factor ETF (QVM), Direxion iBillionaire Index ETF (IBLN), iShares US Home Construction ETF (ITB), WBI Tactical SMV Shares (WBIB), US Global Jets ETF (JETS), and PowerShares WilderHill Progressive Energy Portfolio (PUW).
Disclosure: The author has no positions ...
more

