
Bullish Technical Indicators, Dollar & Gold – Weekly Market Outlook
With a possible end (more or less) to the Greek debt crisis taking shape last week, investors were once again confident enough to get back to their buying ways. When it was all said and done, the market gained about 2.4%, crawling back above some key resistance levels in the process.
And yet, stocks didn't quite clear their biggest hurdles, and in rare cases where the indices managed to make good technical progress, they ran into other walls. In other words, there are still several ways from here the bears could capitalize on the market's weak points.
We'll take a look at all the market's pros and cons in a moment, after a quick review of last week and this week's key economic numbers.
Economic Data
It was plenty busy last week in terms of economic news, but two sets of data came to the forefront. On Wednesday we got June's capacity utilization and industrial productivity figures. After some softness in the first and second quarters of the year, each appears to be pointed higher again. That said, one good month – or even two good months – doesn't make or break a trend.
Industrial Production and Capacity Utilization Chart
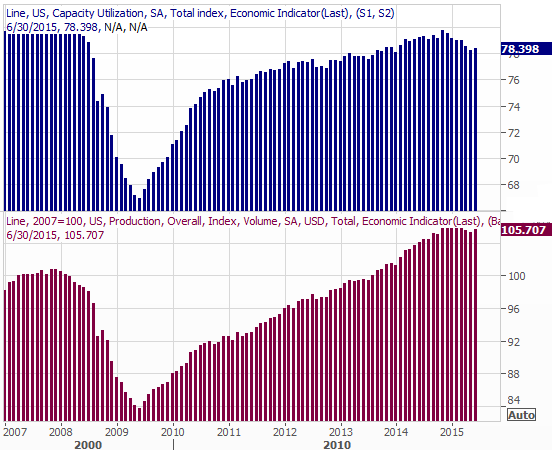
Source: Thomas Reuters
Then on Friday we learned June's levels of housing starts and building permits. They were, in a word, impressive, at or near multi-year highs in both cases. Neither hit those big levels out of the blue, however. They've each been trending higher for a couple of years now, suggesting the growth is healthy and sustainable.
Housing Starts and Building Permits Chart
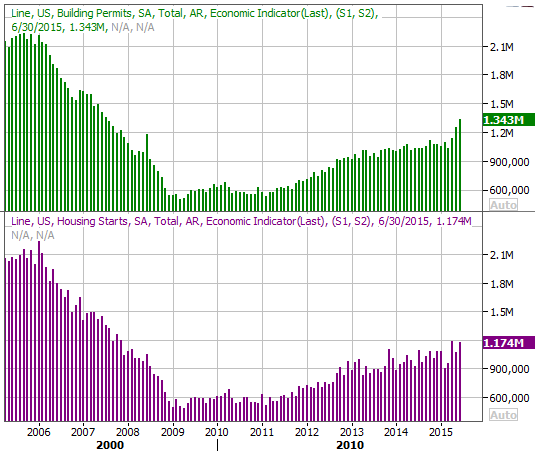
Source: Thomas Reuters
Everything else is on the following grid:
Economic Calendar
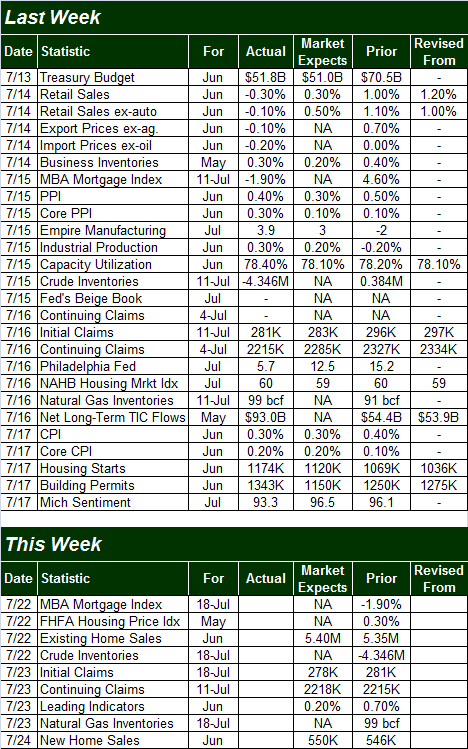
Source: Briefing.com
We'll continue to flesh out the current state of the real estate market this week, with June's existing-home sales tally on Wednesday, and the new-home sales pace on Friday. Both have been trending higher for some time (albeit a choppy trend), and are expected to extend those uptrends through last month.
New Home and Existing Home Sales Chart
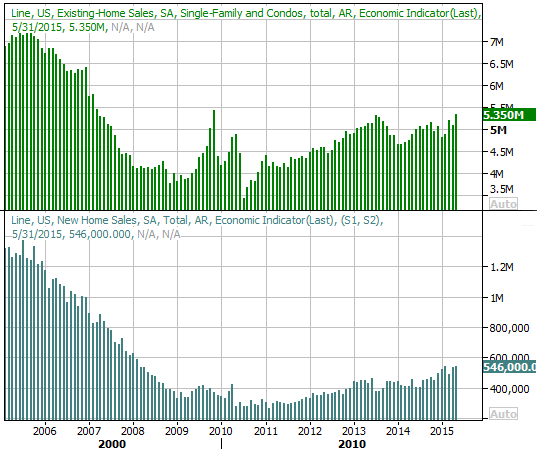
Source: Thomas Reuters
Stock Market Index Analysis
The bulls are now back in charge, with last week's bounce carrying all the major indices back above key short-term moving average lines. And yet, even more caution than usual is advised at this time. The market has raced up to critical inflection levels, but has suspiciously not moved past them. In light of the market's recent penchant for reversal, this failure to move beyond important lines in the same may well be a big but subtle clue.
The daily chart of the S&P 500 (SPX) (SPY) tells a big chunk of the tale. The index ended the week on a bullish note, but clearly hesitated when it came time to move past the June peak around 2130.
S&P 500 & VIX Daily Chart
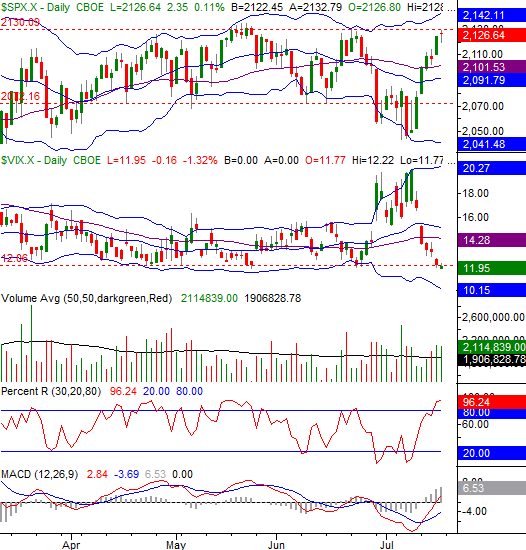
Chart created with TradeStation
Coincidence? Possibly, though not one we'd blindly assume was a matter of mere chance.
The tough part about this chart is that in many other circumstances, it would be solidly bullish. The Percent R line is back above the 80 mark (using the BigTrends method on that indicator), and though that's not a textbook confirmed bullish signal yet, it's close to one. The bullish confirmation from the Percent R line will be a lull in the line followed by an upward move again on the same day the S&P 500 itself makes a higher high. That would by default mean the market's move above the June peak.
You'll also see the MACD lines have made a clear bullish divergence, even if both of the MACD lines have yet to move above the zero level… another confirming sign.
The NASDAQ Composite (COMP) serves up some similar clues, though not identical ones. That is, the composite has now almost run into its upper Bollinger band – another key ceiling – after reversing course at a major floor around 4903 two weeks ago. The momentum is encouraging, though the market's frequent reversals from such strong moves is concerning.
NASDAQ Composite & VXN Daily Chart
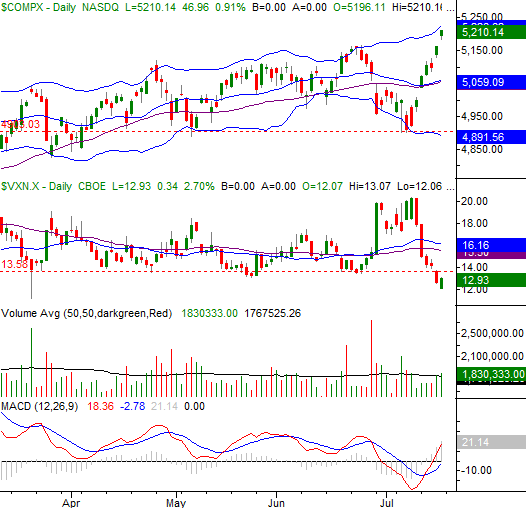
Chart created with TradeStation
Yes, the NASDAQ's Volatility Index (VXN) (a counterpart to the SPX-based CBOE Volatility Index (VIX) (VXX)) has broken under a support level at 13.6, but that level was already uncomfortably low, and anything under that line may simply be unsustainable.
Zooming out to a weekly chart of the NASDAQ Composite truly puts in perspective just how unusual last week was…. and also underscores the idea that the move itself may have left no more room for more forward progress. The composite's upper 26-week Bollinger band has stepped up as a ceiling, and the VXN is back at (and even below) a major support line.
NASDAQ Composite Weekly Chart
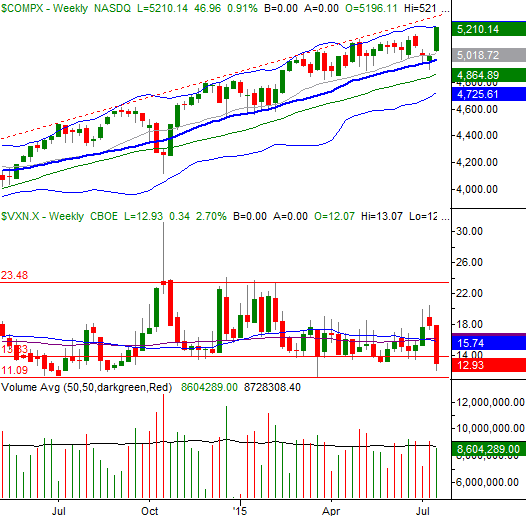
Chart created with TradeStation
The S&P 500's weekly chart looks similar to the NASDAQ's weekly chart.
There's a little more room for stocks to keep moving… though only very little. Past that, any more bullishness would move into the "unusual" or "breakout" category. That being said, there's no assurance stocks will even move higher at all. The way the indices were stopped cold on Friday (an option expiration day, by the way) is suspicious. Anything above Friday's highs and the technical ceilings just a bit above where we are now is a proverbial no-man's land. This is one of those rare situations where the wise move may simply be standing back and seeing where the chips fall, and then making a play.
Dollar, Gold Move Past Key Levels
For a brief while in Q2 it looked like the U.S. Dollar (USD) (UUP) would finally peel back from dizzying heights hit in March. But, given the action we've seen from the U.S. Dollar Index in the meantime, clearly the greenback isn't ready to retreat just yet. With a push off of its 20-day and 50-day moving average lines (which have just given us a new bullish crossover, by the way), the U.S. Dollar Index has now moved above its peak at 97.78.
That move has largely driven the demise of Gold (GLD) prices, which took a major turn for the worst last week. That is, gold futures finally fell below a key technical floor at $1142.50/ounce.
Gold and U.S. Dollar Charts
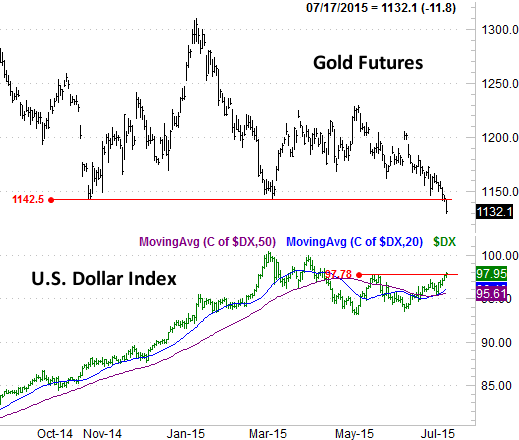
Chart created with TradeStation
It remains to be seen if this is going to have a cascading effect, though from a conventional technical analysis view, this is concerning. Even if we see some bullishness materialize, unless the price of gold breaks back above $1142.50, the tide here is now in bearish territory.
Trade Well,
Price Headley
Disclosure: None.


