
Brexit News Causes GBP/USD Bearish Break And Bullish Reversal
GBP/USD
4 hour
(Click on image to enlarge)
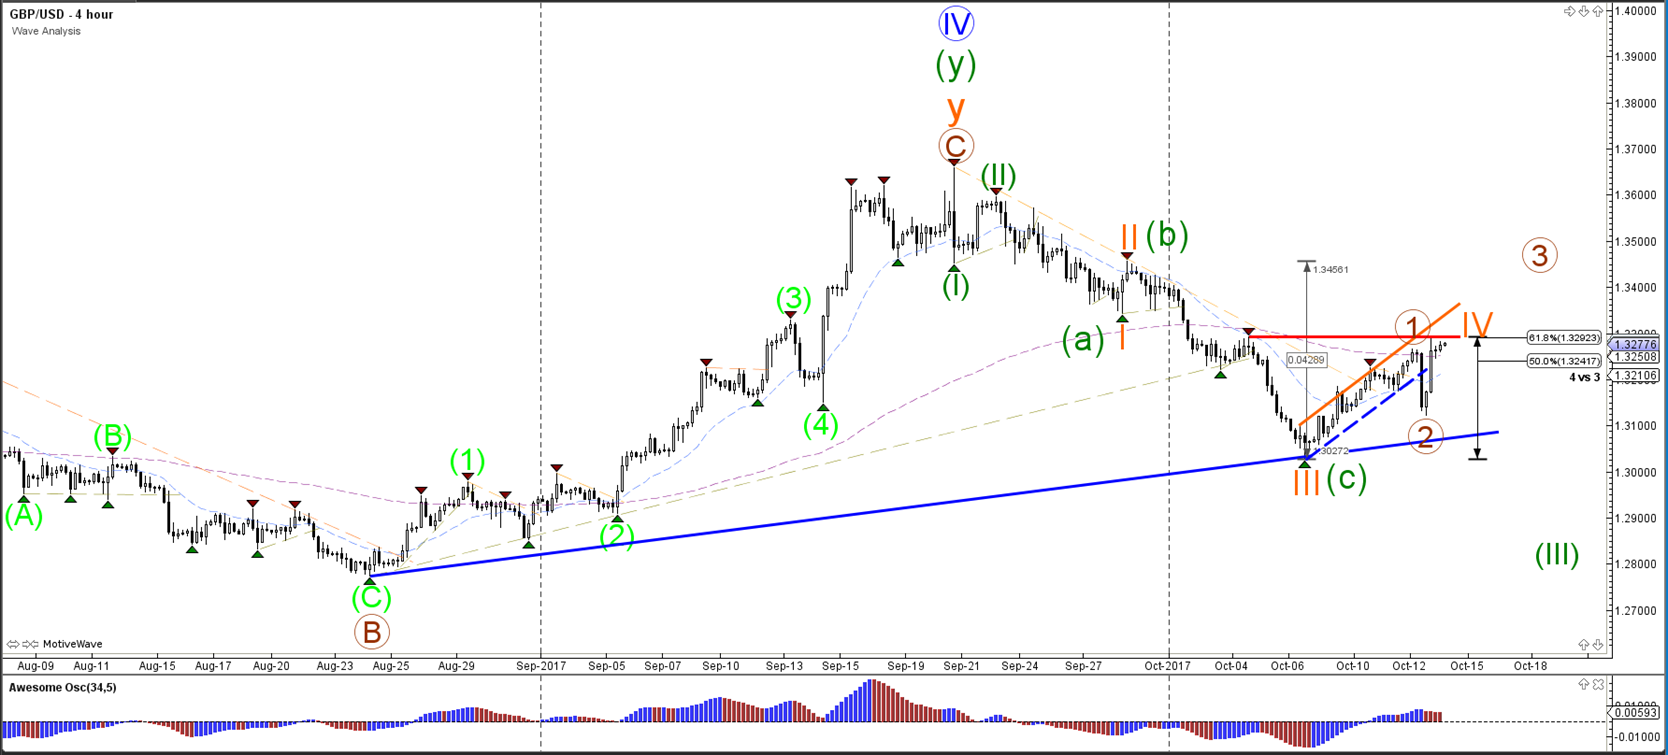
The GBP/USD broke the support trend line (dotted blue) but failed to break below the previous bottom and is now challenging again the resistance zone (red) and Fibonacci levels of wave 4 (orange). A bullish break would change the wave patterns and could indicate a bullish 123 (brown) or larger ABC. The strong up and down could have been caused by the Brexit news which first
1 hour
(Click on image to enlarge)

The GBP/USD bounced strongly at the 61.8% Fibonacci support level creating a "V valley" reversal after strong bearish momentum occurred with a 150 pip decline. The extended bullish correction could be a WXY (brown) within wave 4 (orange). A bullish break would make a wave 4 pattern less likely.
EUR/USD
4 hour
(Click on image to enlarge)
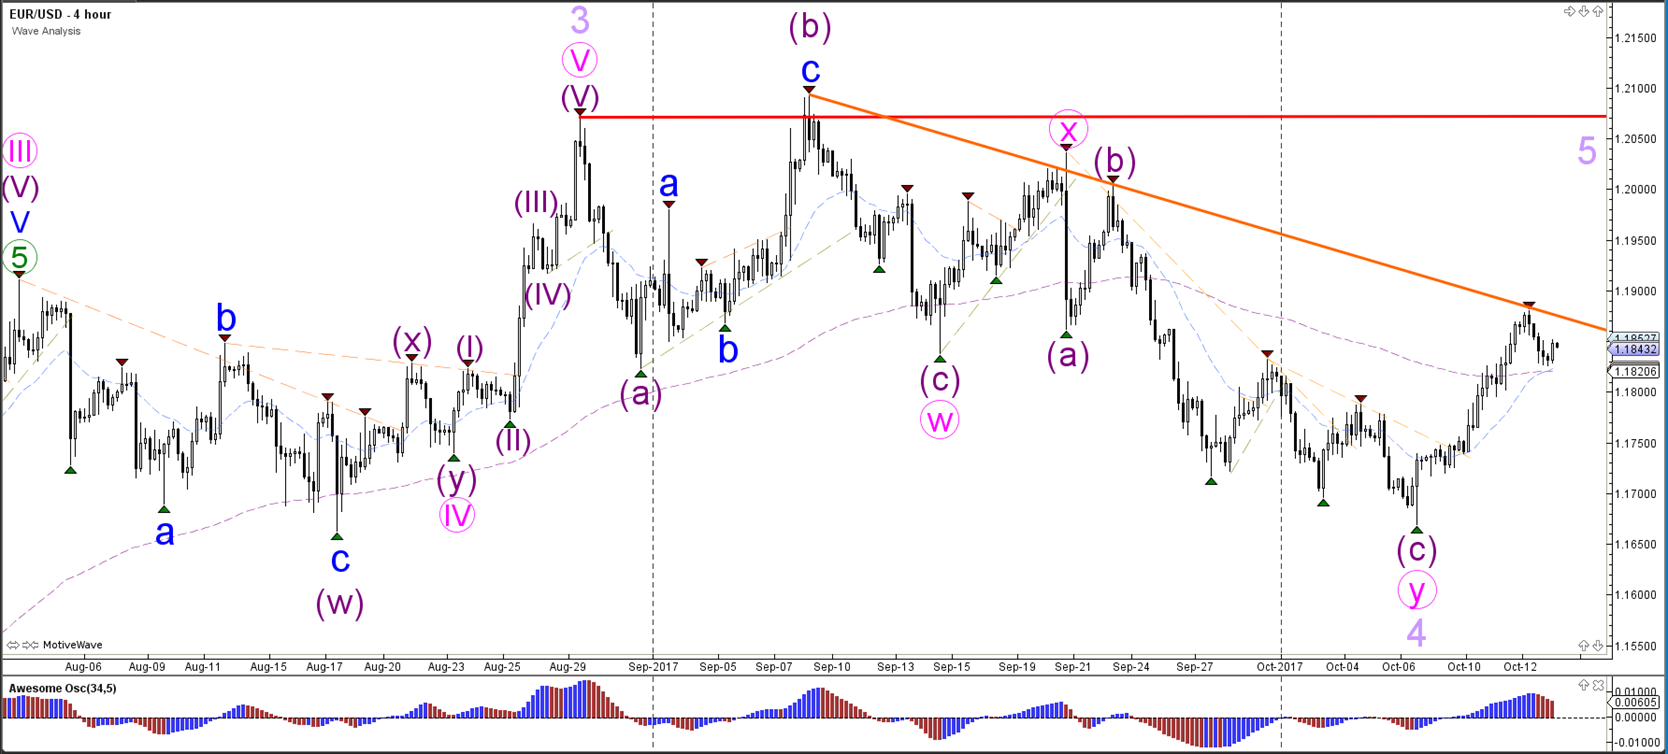
The EUR/USD is challenging a resistance trend line (orange). A bullish breakout could see price challenge the larger resistance (red) but it remains unclear whether price is in a wave 5 or in an expanded wave 4 at the moment.
1 hour
(Click on image to enlarge)
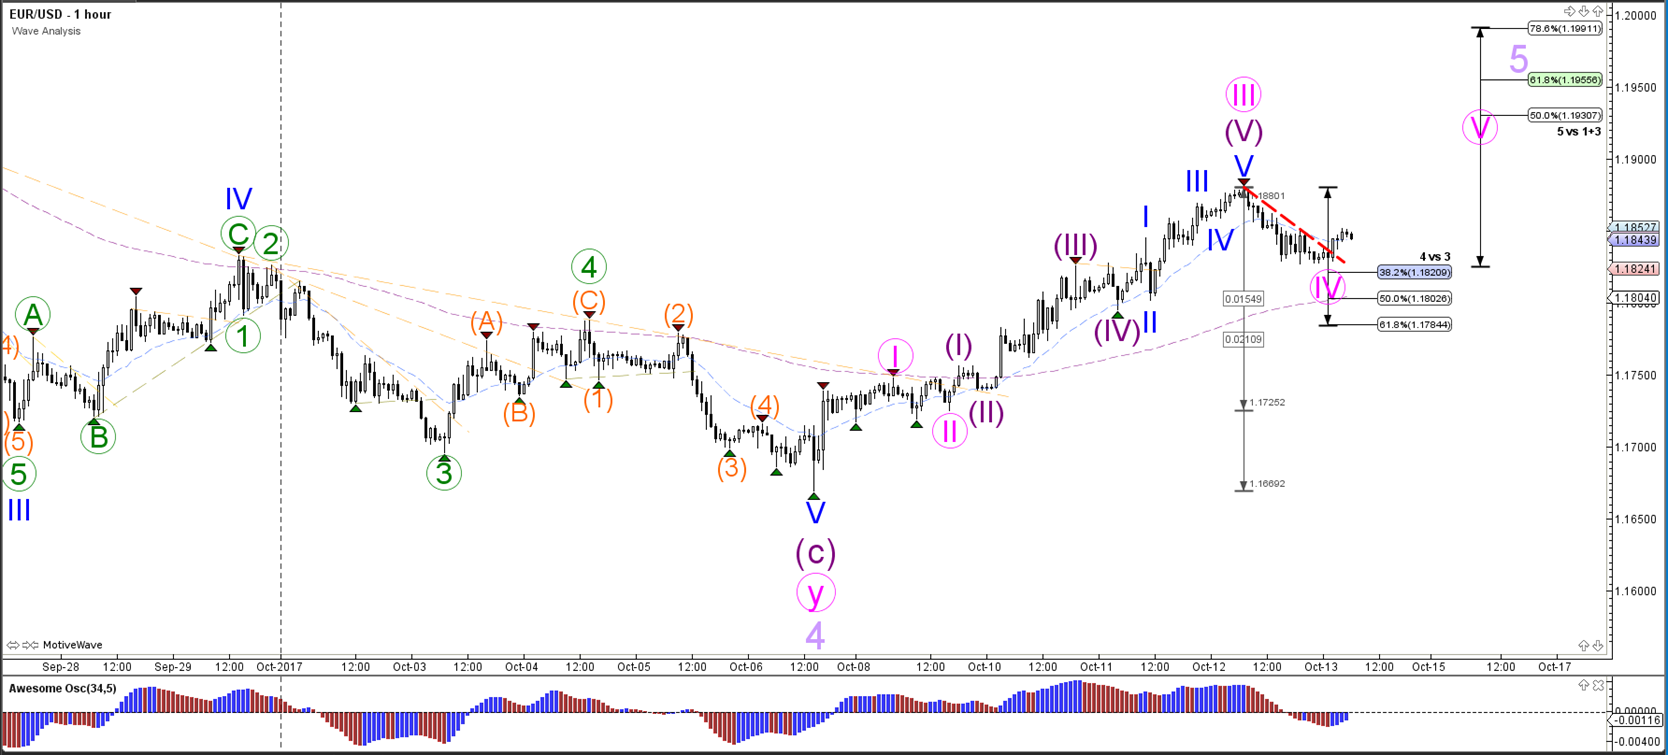
The EUR/USD has retraced back to the 38.2% Fibonacci level of wave 4 (pink). Price could be ready for a bullish continuation as long as price stays above the 61.8% Fibonacci level.
USD/JPY
4 hour
(Click on image to enlarge)
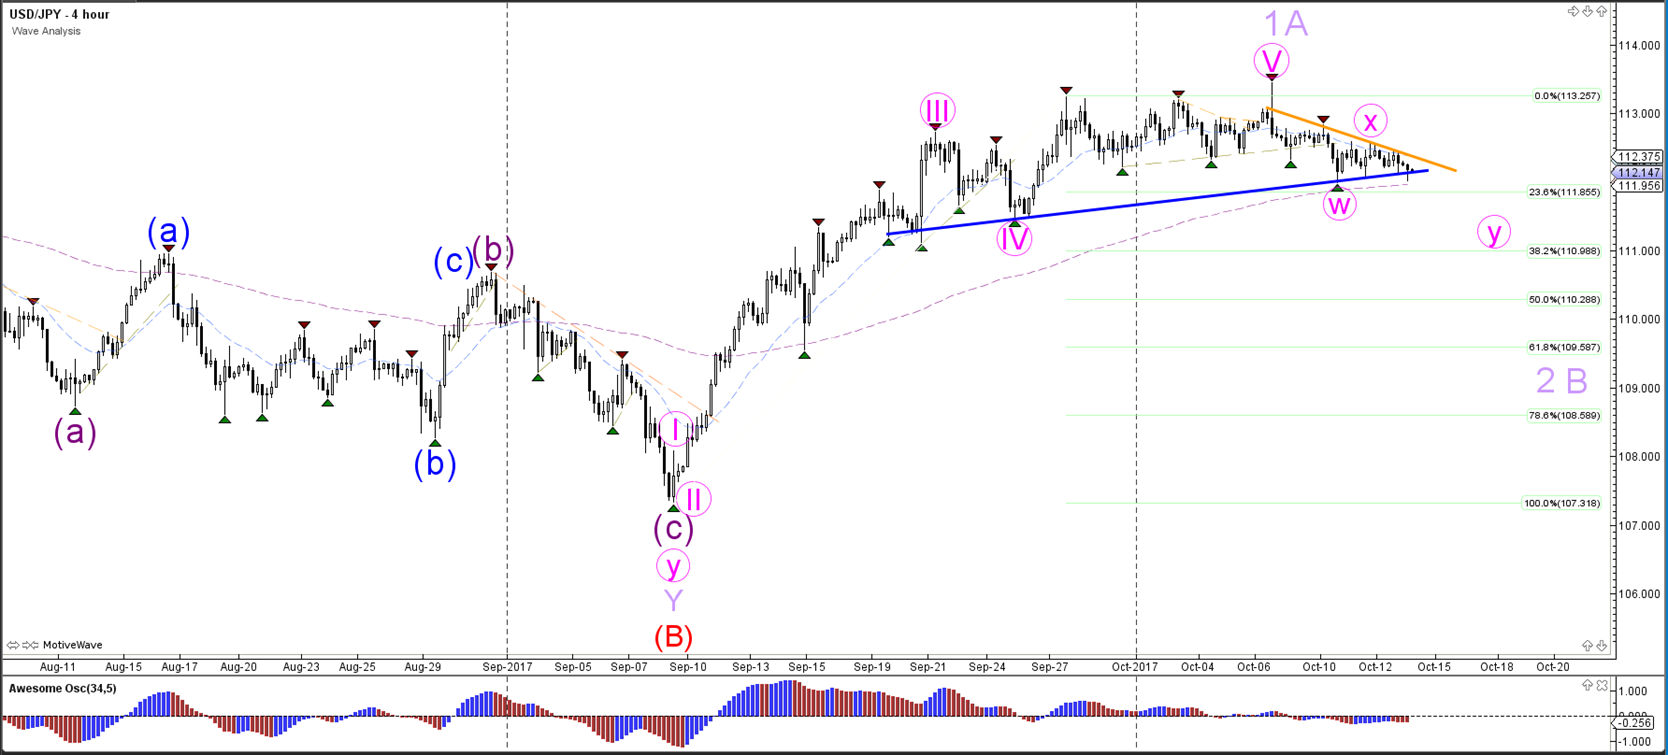
The USD/JPY could be building a larger WXY (pink) correction within wave 2 or B (purple).
1 hour
(Click on image to enlarge)

The USD/JPY could be completing a potential ABC (purple) correction within wave Y (pink).
Disclaimer: Trading foreign exchange or contracts for differences on margin carries a high level of risk, and may not be suitable for all investors. There is a possibility that you may sustain a ...
more

