
Breaking Higher? Stocks At A Crossroads
The U.S. stock market indexes gained 0.1-0.5% on Friday, as investors' sentiment slightly improved following Nonfarm Payrolls number release. The S&P 500 index extends its short-term fluctuations following a breakout above the level of 2,800. It currently trades just 1.1% below the January's 26th record high of 2,872.87. The Dow Jones Industrial Average gained 0.5% and the technology Nasdaq Composite gained 0.1% on Friday.
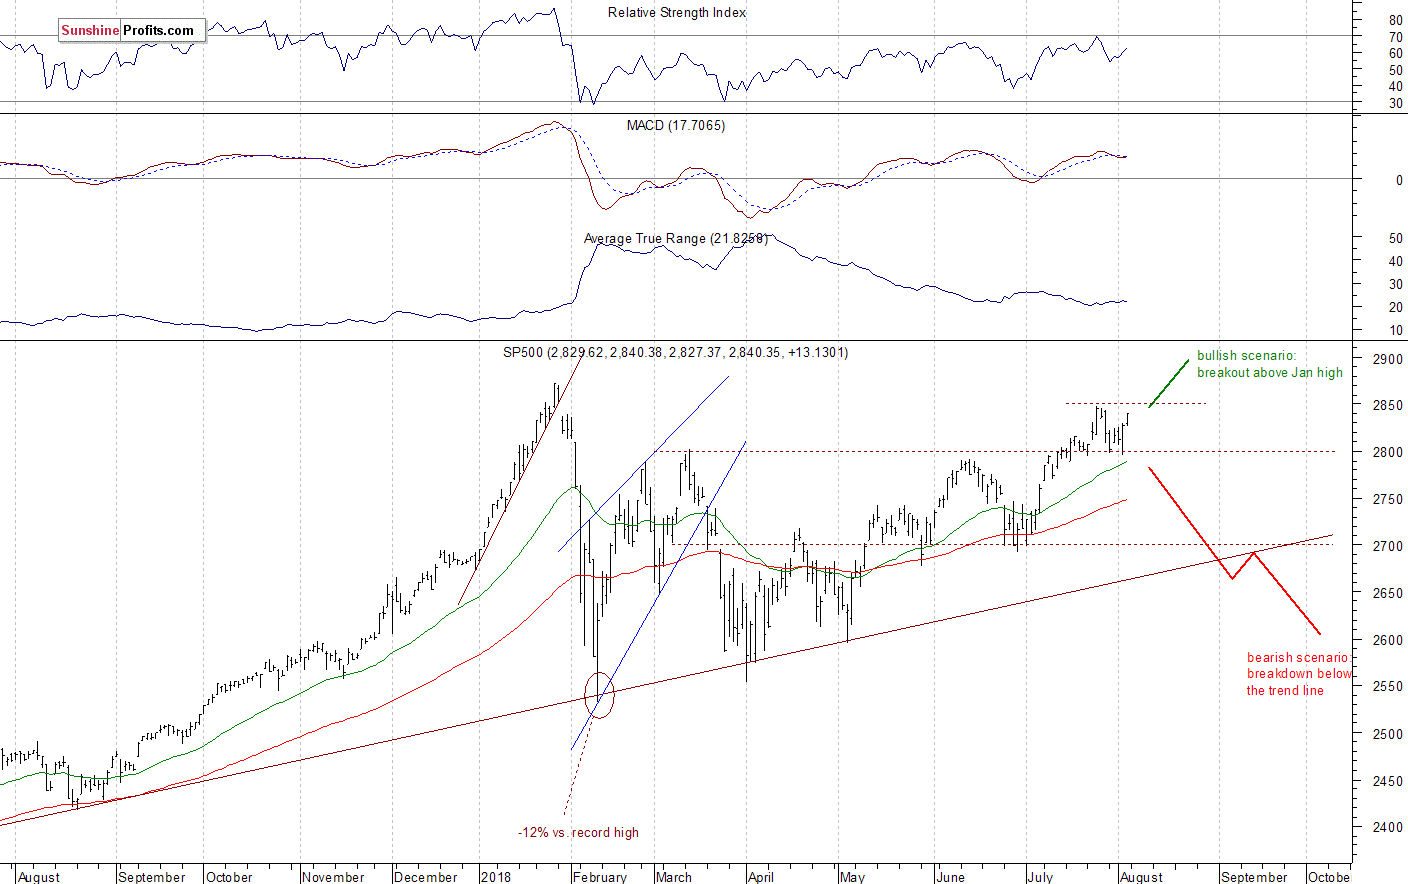
The nearest important level of support of the S&P 500 index is at around 2,800, marked by the previous resistance level. The support level is also at 2,780-2,790. On the other hand, the nearest important level of resistance is at 2,850, marked by the late July local highs. The next resistance level is at around 2,870, marked by the mentioned January's all-time high.
The broad stock market got closer to its January's record high in the late July, as investors' sentiment improved following quarterly corporate earnings, economic data releases. The S&P 500 index broke above the level of 2,800, but then it failed to continued above 2,850 mark. Is this a topping pattern or just some relatively flat correction within an uptrend. For now, it looks like a correction. However, there are still two possible medium-term scenarios - bearish that will lead us towards the February low again, and the bullish one - breakout higher towards 3,000 mark. The latter one is getting more and more real. The S&P 500 index still seems to be "climbing a wall of worries" here:
(Click on image to enlarge)
Uptrend to Continue?
The index futures contracts trade between +0.1% and +0.2% vs. their Friday's closing prices. So the expectations before the opening of today's trading session are slightly positive. The main European stock market indexes have gained 0.2-0.4% so far. There will be no new important economic data announcements today. The S&P 500 index will probably extend its short-term fluctuations following last month's breakout above the level of 2,800. If the market breaks above the level of 2,850, we could see more buying pressure.
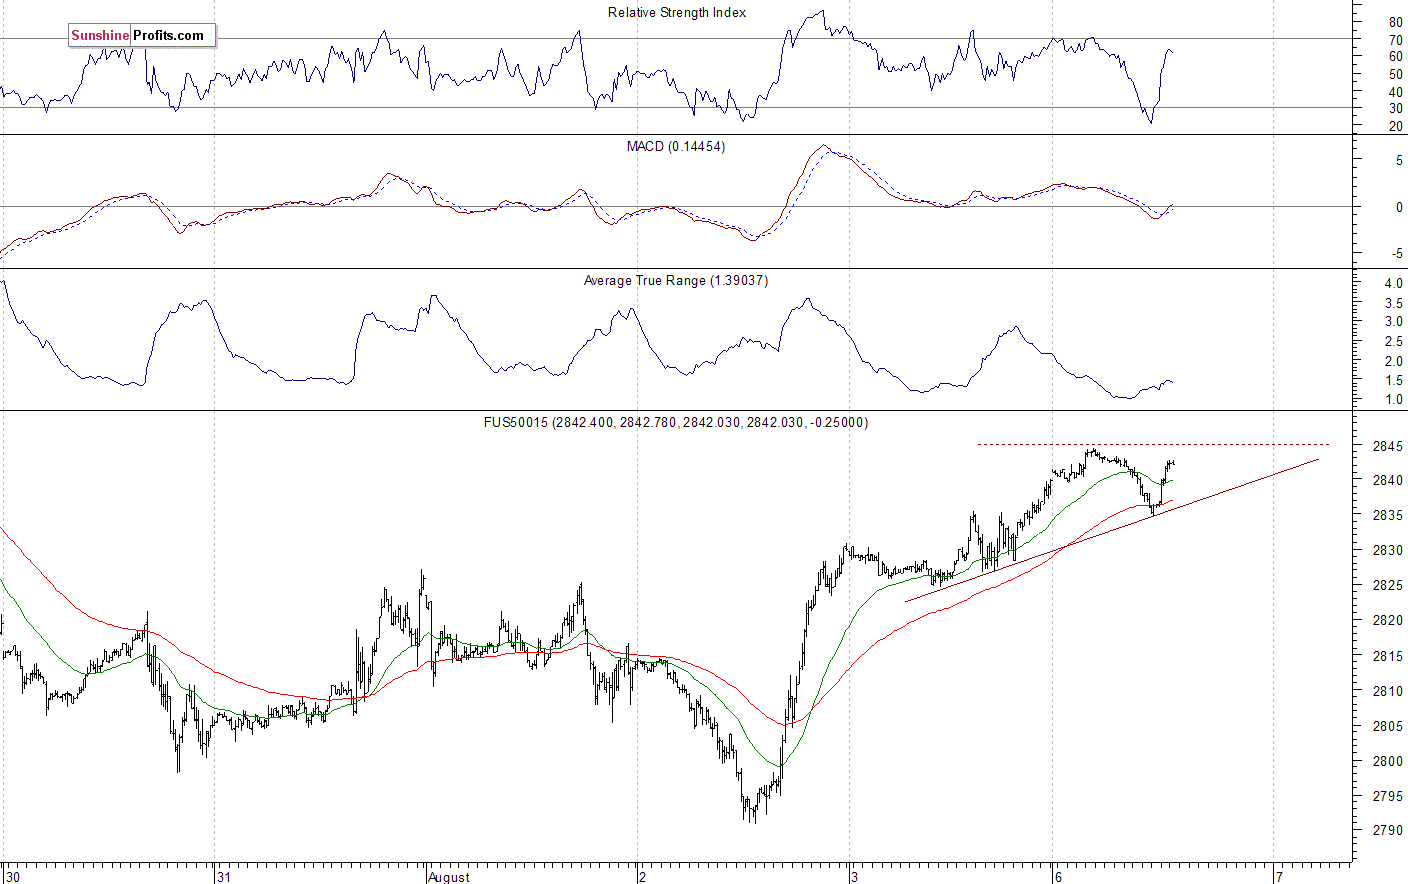
The S&P 500 futures contract trades within an intraday uptrend, as it retraces some of its overnight decline. The nearest important level of resistance is at around 2,840-2,845, marked by the short-term local highs. The resistance level is also at 2,850. On the other hand, level of support is at 2,725-2,730, marked by the recent short-term consolidation. The futures contract trades above its short-term upward trend line, as we can see on the 15-minute chart:
(Click on image to enlarge)
Nasdaq at 7,400 Again
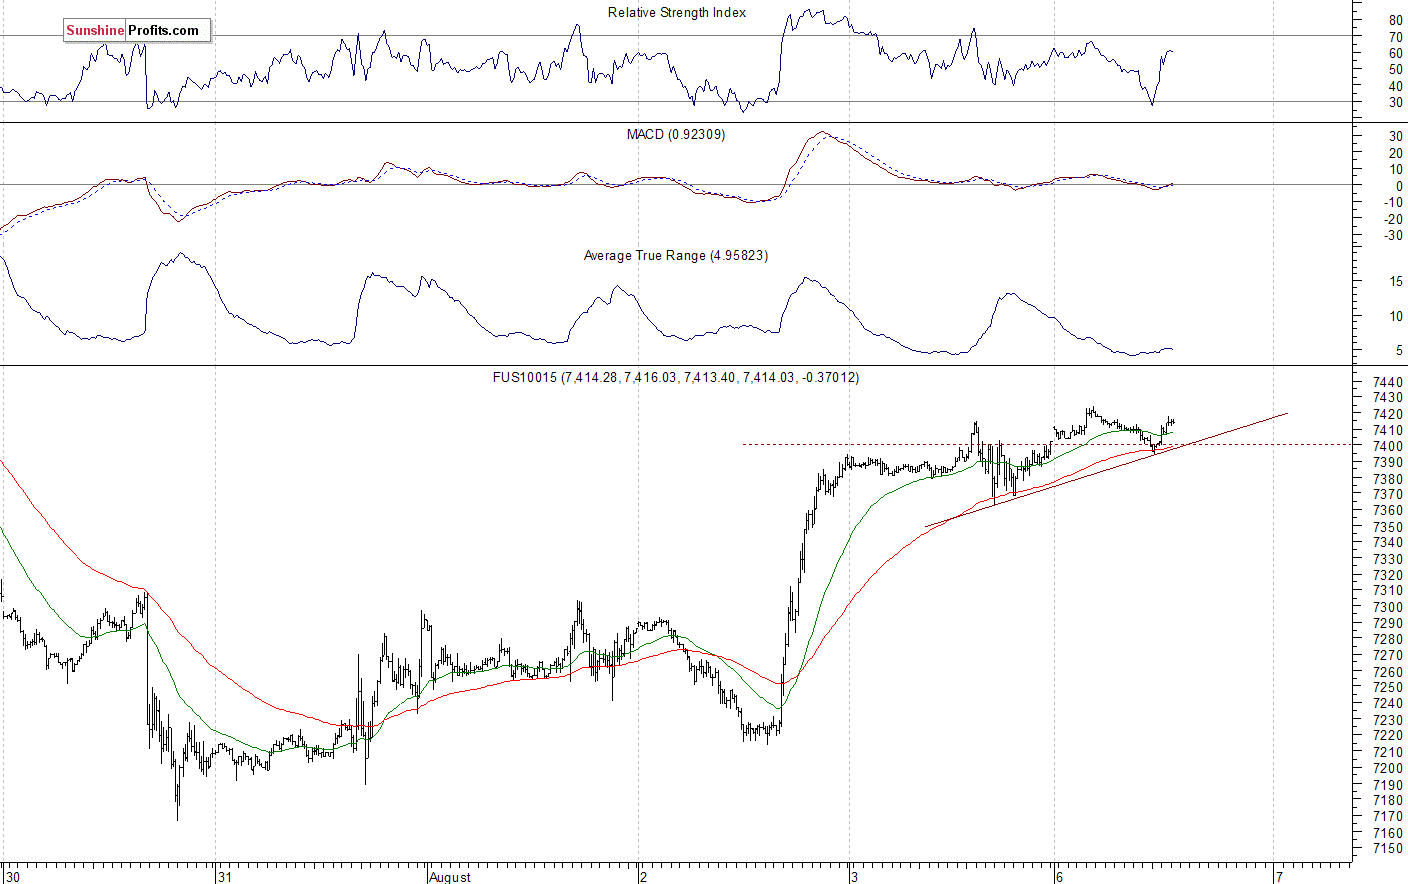
The technology Nasdaq 100 futures contract follows a similar path, as it retraces its overnight decline. The market remains below its late July record high of around 7,530. Will it get back above 7,500 mark? It's hard to say. However, there have been no confirmed negative signals so far. The nearest important level of resistance is at around 7,450-7,470, marked by the previous local high. On the other hand, support level is at 7,350, among others. The Nasdaq futures contract trades along the level of 7,400, as the 15-minute chart shows:
(Click on image to enlarge)
Big Cap Tech Stocks - Mixed Picture Following Earnings Releases
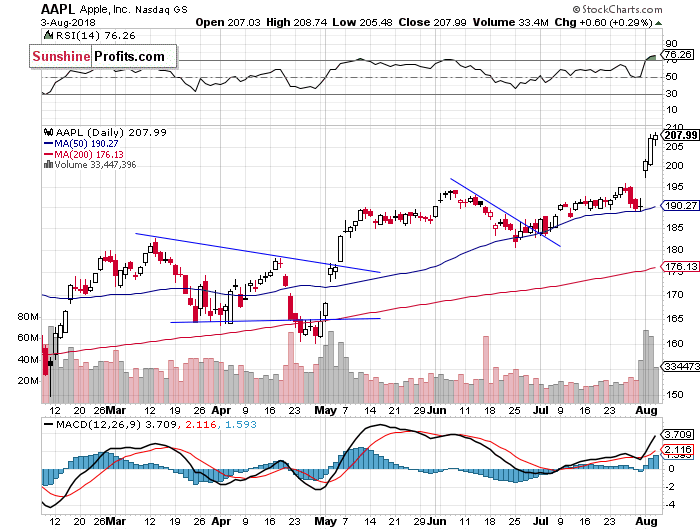
Let's take a look at Apple, Inc. stock (AAPL) daily chart (chart courtesy of http://stockcharts.com). The stock continued its uptrend on Friday, as it reached yet another new record high above the level of $200. Will it continue higher despite some clear short-term technical overbought conditions? There have been no confirmed negative signals so far. The nearest important level of support is now at $190-200, marked by the previous resistance level:
(Click on image to enlarge)
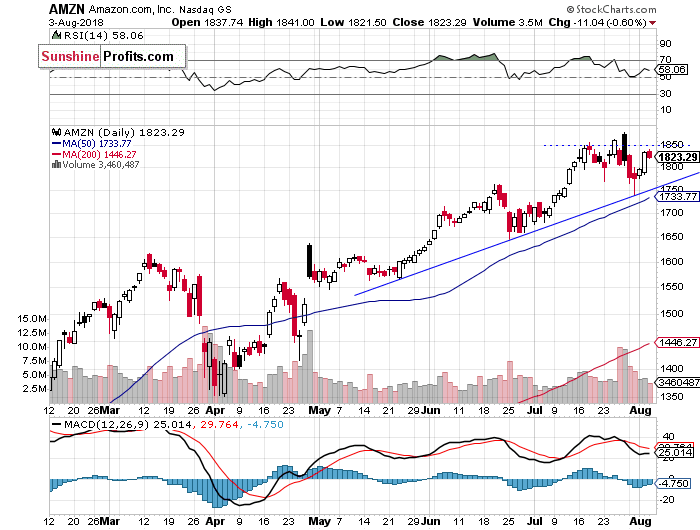
Now let's take a look at Amazon.com, Inc. stock (AMZN) daily chart. It reached the new record high above the level of $1,850 recently, but it then it retraced some of the rally. The nearest important level of resistance remains at around $1,850. On the other hand, support level is at $1,750, marked by the medium-term upward trend line:
(Click on image to enlarge)
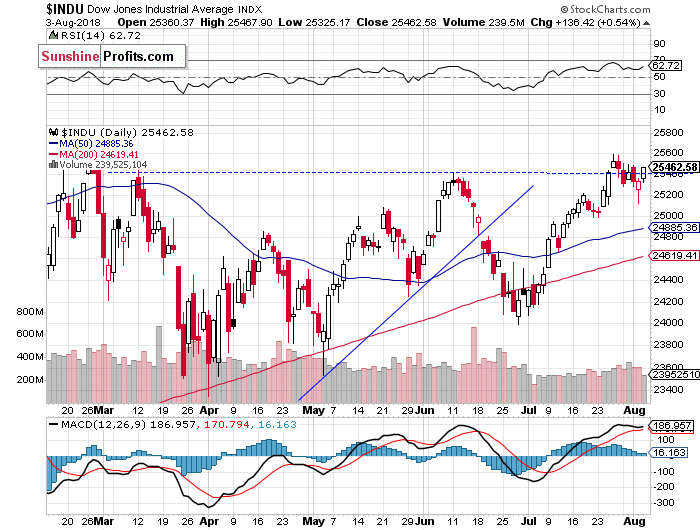
Dow Jones Remains Close to 25,500
The Dow Jones Industrial Average extended its fluctuations along the level of 25,500 last week. For now, it looks like some relatively flat correction within an uptrend. The nearest important level of support remains at around 25,000, marked by the previous local lows. On the other hand, level of resistance is at 25,600, among others:
(Click on image to enlarge)
The S&P 500 index got closer to its late July local highs on Friday, as investors' sentiment improved following Nonfarm Payrolls number release. Will the broad stock market continue towards its January's record high this time? There have been no confirmed negative signals so far. The index is just 1.1% below the record high.
Concluding, the broad stock market will likely open slightly higher today. The sentiment improved following an overnight weakness, so we may see a further advance. However, there are some relatively strong resistance levels ahead.
Disclosure: None.


