
Brazil's Back And U.S. Soybeans To China Are Getting Hammered, Good News On U.S.-China Trade
A lot of people don't know this, but the humble soybean ranks among the top products that the United States exports to China. The vast majority of those exports come in the months from September through December each year and, if the U.S. Census Bureau's data on U.S. soybean exports to China is any indication, 2017 is lagging far behind 2016.
(Click on image to enlarge)
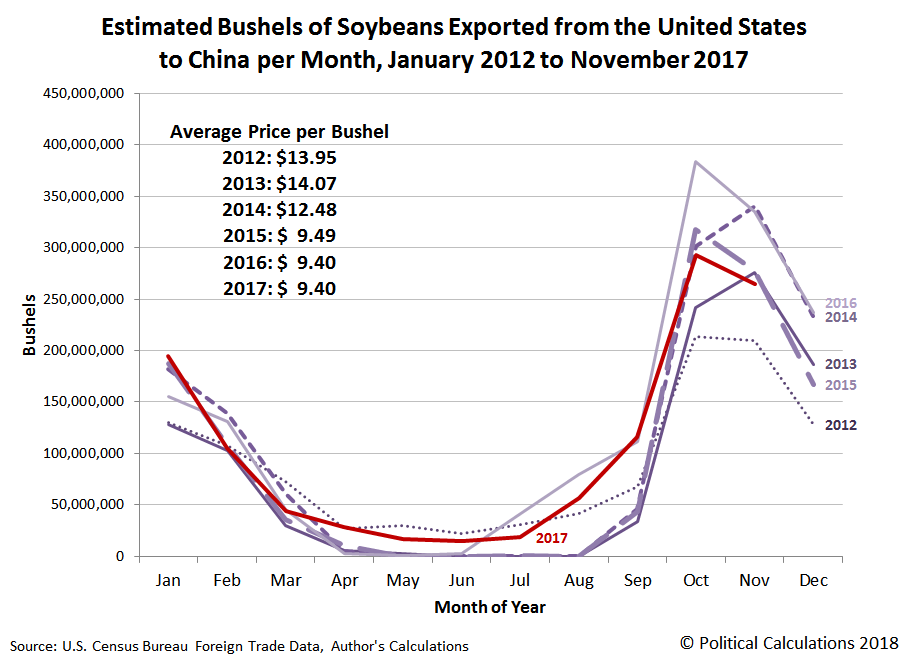
For the peak export month of October, the estimated volume of soybeans being shipped from U.S. ports to China has fallen by 91.5 million bushels from 2016's record 384.3 million bushels (a 24% drop). Likewise, the just-released data for November 2017 indicates that month's 264.6 million exported bushels of soybeans is 21% below 2016's level of 335.2 million bushels. And all this is happening as the price of soybeans has been largely stable at an average of $9.40 per bushel from 2016 to 2017.
2016 was an unusual year for soybean exports for two main reasons. First, U.S. farmers had a bumper crop of the oilseed, which was especially good news because of the world's second-largest grower and exporter of soybeans, Brazil, endured drought conditions that significantly reduced its crop as the second reason. In 2017 however, Brazil is back, reclaiming much of its market share with China, the world's largest importer of soybeans.
For the overall state of U.S. exports to China, you might expect then to see a spike the year over year growth rate of exports in late 2016, which would then not be present in 2017. Worse, with such a large decline in U.S. soybean exports to China, you might expect that the growth rate of the overall value of U.S. exports to China could even be negative. The following chart shows what we're really seeing today.
(Click on image to enlarge)
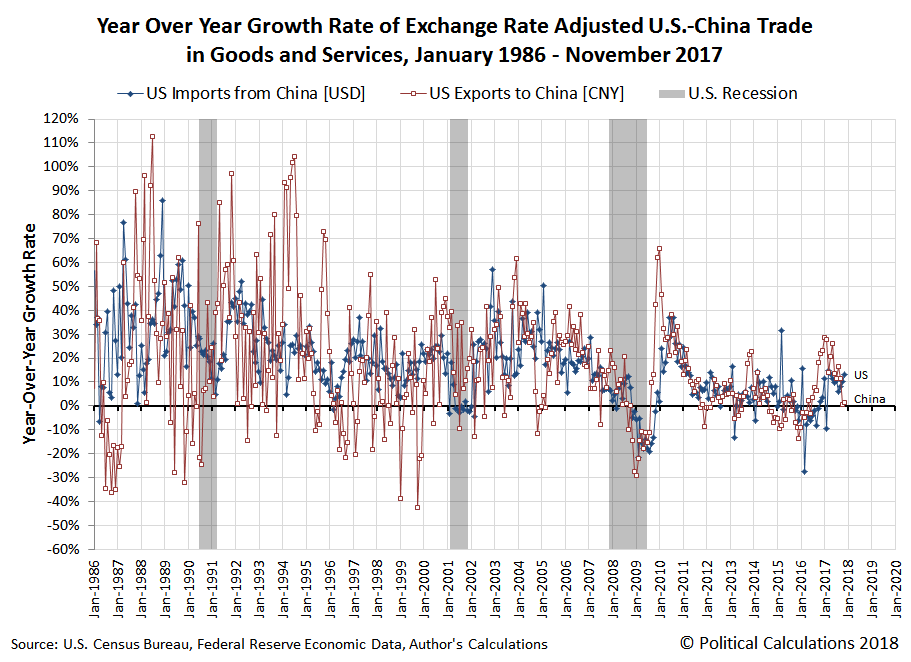
Instead of being negative, the year over year growth rate of the value of the goods and services that the U.S. exports to China just above the zero growth line for both October and November 2017.
Remember that these months saw the year over year growth rate of U.S. exports to China spike a year earlier, thanks to the record surge in U.S. soybean exports that year. For the estimated volume of those exports to have declined by over one-fifth in 2017 and to still have enough other exports to fill the gap so that the overall value of U.S. goods going to China is slightly positive is an indication of how successful the U.S.' other export products to China have been in 2017.
A big portion of those additional exports is in the form of crude oil, which is a story that we'll follow up next month after the U.S. Census Bureau releases its trade data for December 2017.
Disclaimer: Materials that are published by Political Calculations can provide visitors with free information and insights regarding the incentives created by the laws and policies described. ...
more

