
Blue Chips Take The Lead, Enough To Push Higher?
The U.S. stock market indexes gained between 0.7% and 1.4% on Wednesday, extending their short-term uptrend, as investors' sentiment continued to improve and blue-chip stocks regained their strength. The S&P 500 index broke above 2,750 mark and it currently trades just 3.5% below January's 26th record high of 2,872.87. The Dow Jones Industrial Average gained 1.4%, as it was relatively stronger than the broad stock market yesterday, and the technology Nasdaq Composite gained 0.7%.
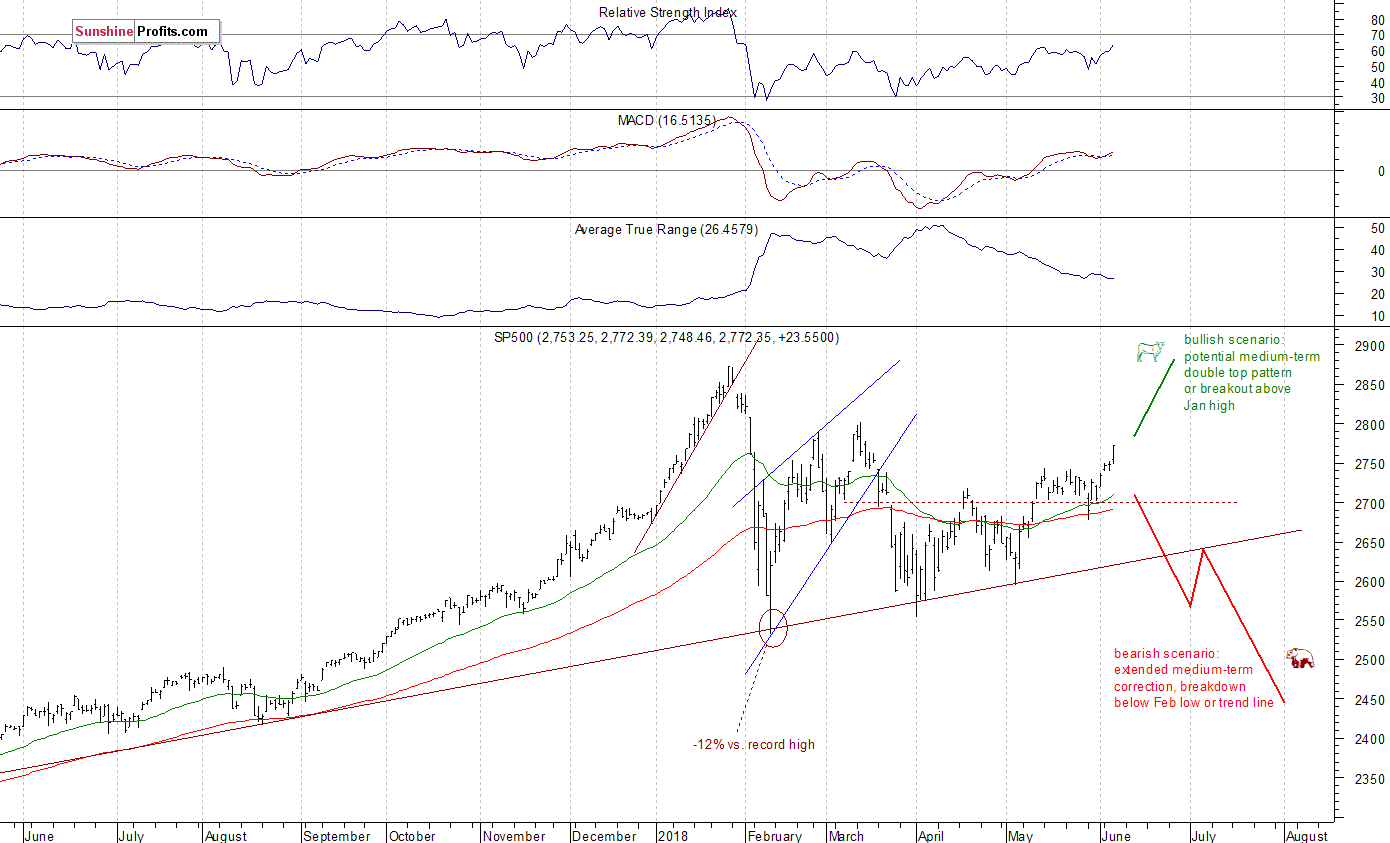
The nearest important level of resistance of the S&P 500 index is now at around 2,780-2,800, marked by mid-March local high. The next resistance level is at 2,830-2,840, marked by the late January short-term consolidation. On the other hand, support level is at 2,750, marked by recent level of resistance. The support level is also at 2,735-2,740, marked by Monday's daily gap-up of 2,736.93-2,740.54.
The broad stock market accelerated its short-term uptrend yesterday, as the S&P 500 index broke above resistance level of 2,750. Will it continue higher despite short-term overbought conditions? We may see some uncertainty and profit taking action today. There are still two possible medium-term scenarios - bearish that will lead us below February low following trend line breakdown, and the bullish one in a form of medium-term double top pattern or breakout towards 3,000 mark. There is also a chance that the market will just go sideways for some time, and that would be positive for bulls in the long run (some kind of an extended flat correction):
Mixed Expectations, Correction or Just Pause?
The index futures contract trade between 0.0% and +0.2% vs. their yesterday's closing prices, so expectations before the opening of today's trading session are virtually flat to slightly positive. The main European stock market indexes have been mixed so far. Investors will wait for the Initial Claims number release at 8:30 a.m. The broad stock market will likely fluctuate following yesterday's advance. Will we see a downward correction at some point? The index may retrace some of its yesterday's breakout above resistance level of 2,750, but there have been no confirmed negative signals so far.
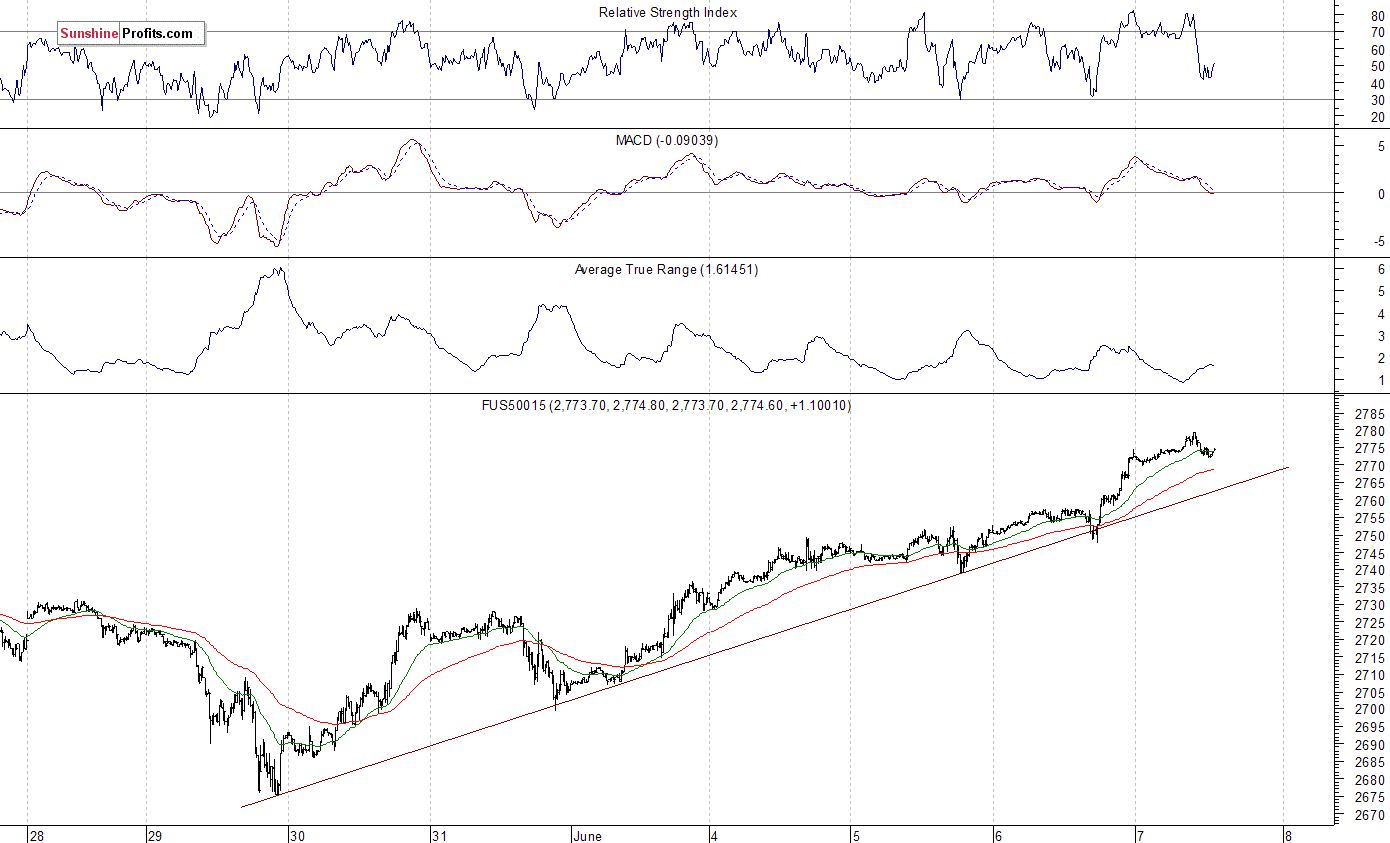
The S&P 500 futures contract trades within an intraday consolidation, as it retraces some of its overnight advance. The market bounced off resistance level at around 2,780. Potential level of resistance is also at 2,800. On the other hand, support level is at 2,770, and the next level of support is at 2,750-2,760. The futures contract continues to trade above its week-long upward trend line, as the 15-minute chart shows:
Nasdaq at New Record High
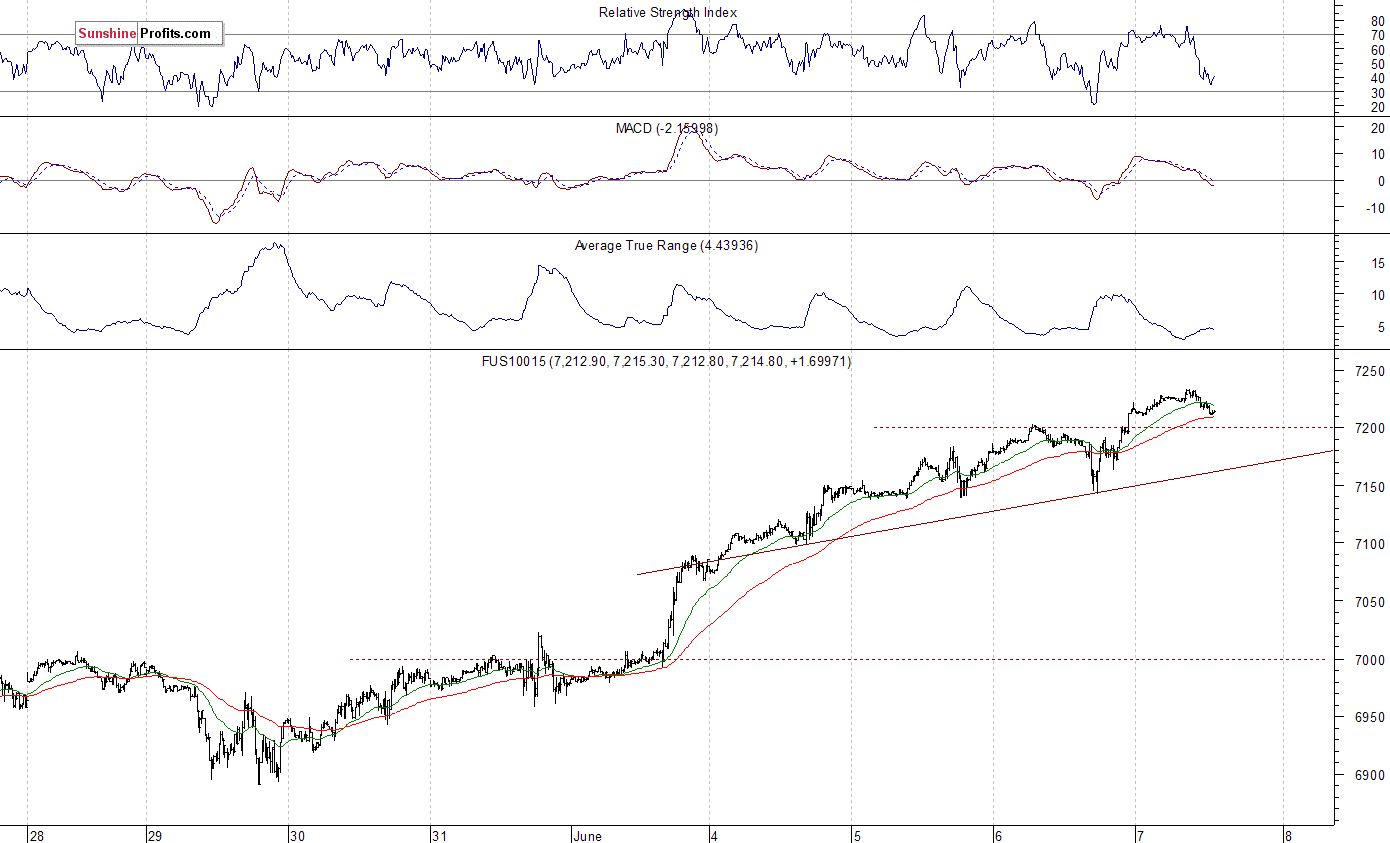
The technology Nasdaq 100 futures contract follows a similar path, as it retraces some of its overnight advance. Tech stocks gauge reached new record high, as it slightly exceeded its mid-March top. The Nasdaq 100 gained over 300 points from last Wednesday's local low. Potential level of resistance is at around 7,230, marked by new record high. On the other hand, support level is now at 7,100-7,150, among others. The Nasdaq futures contract remains above the level of 7,200, as we can see on the 15-minute chart:
Apple, Amazon at Record Highs, but Correction May Come Soon
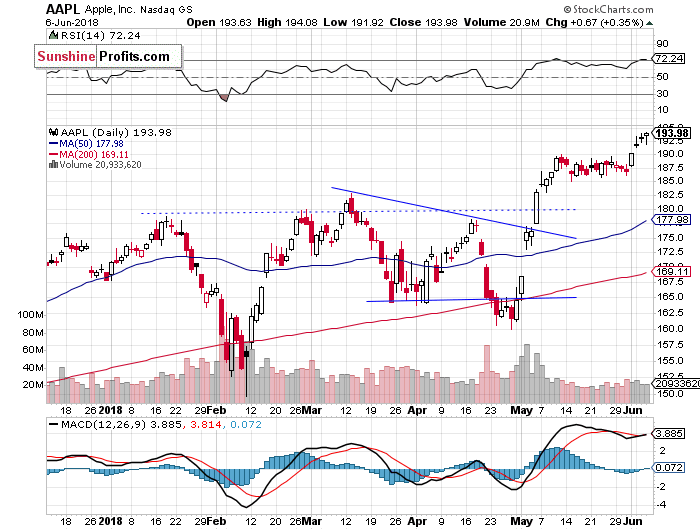
Let's take a look at Apple, Inc. stock (AAPL) daily chart (chart courtesy of StockCharts). It reached another new record high on Wednesday, as it continued its short-term uptrend following Monday's breakout above $190. There is still a potential resistance level of around $200. Investors' sentiment is bullish, but will uptrend continue? There have been no confirmed short-term negative signals so far:
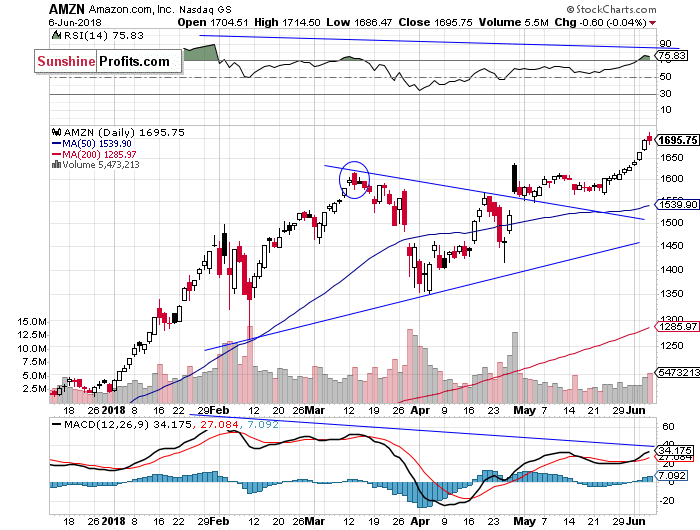
Now let's take a look at Amazon.com, Inc. stock (AMZN) daily chart. It accelerated its uptrend on Tuesday, as price got closer to $1,700. Yesterday, it reached new record high above that level, but it closed slightly negative. We were recently saying that Amazon's price action looked pretty bullish. And the stock did break higher! Now we can see some negative technical divergences, along with short-term overbought conditions. However, there have been no confirmed negative signals so far:
Dow Jones Breaks Higher
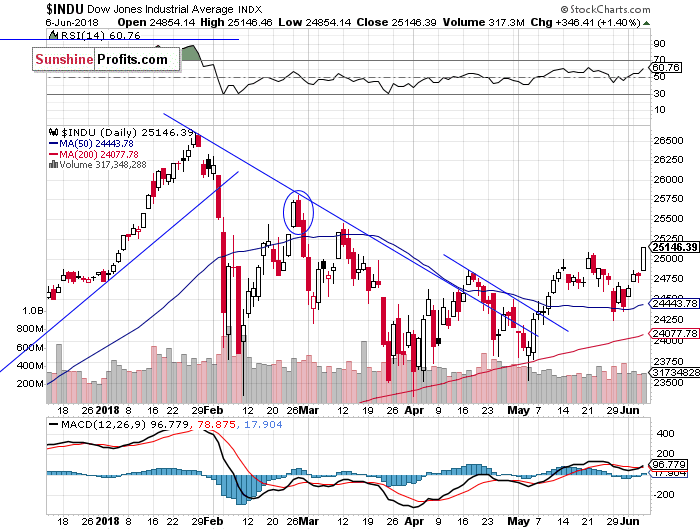
The Dow Jones Industrial Average broke above its medium-term downward trend line in the first half of May. Then it continued higher above a few-week-long downward trend line. However, it kept bouncing off resistance level of 25,000. In the second half of May blue-chip stocks were relatively weaker than the broad stock market, as Dow Jones fell below 24,500 again. Yesterday, we wrote that "the market is taking an attempt at breaking higher". And it did break up above 25,000 mark. We could see some more upward action here:
The S&P 500 index continued its short-term uptrend yesterday, as it broke above the resistance level of 2,750. Expectations before the opening of today's trading session are virtually flat and we may see profit taking action at some point. But there have been no confirmed negative signals so far.
Concluding, the S&P 500 index will likely open virtually flat today. The market may fluctuate after Wednesday's rally. Will uptrend reverse? Probably not. However, we may some downward correction. Tech stocks may be relatively weaker on Thursday, as investors rotate into blue-chip stocks.
Disclosure: None.


