
Blow Off Top…Could It Happen?
Every time we pick up some article on the stock market of late, all we read is the stock market is on the verge of a devastating wipeout, or that the next collapse is just around the corner. One of the best headlines we saw recently was from a famed market guru with a headline of “2017 Is Going to Be Worse than the Great Depression!” It is enough to make you run home, pour a long hot bath, slit your wrists, and climb in to the tub.
Okay, maybe that is extreme. Naturally, there are many reasons writers give to back up their case. Those range from the election of Donald Trump, Brexit, rising interest rates in the US, and of course the best one—that the bull market is now into its ninth year from the major low of March 2009 without a correction exceeding 20% and is in the mother of all bubbles. All of that is true. But none of that makes for a final top just because the stock market has been rising for eight years plus.
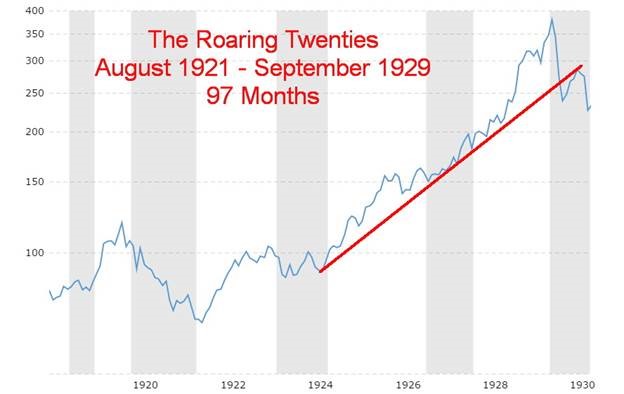
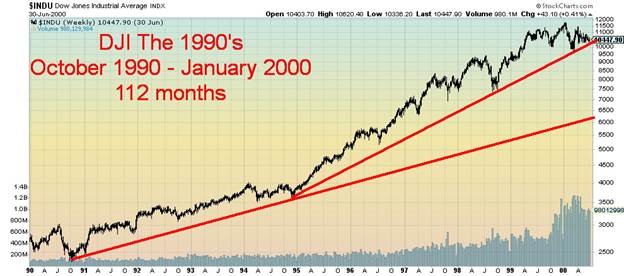
One market often compared to today is the “Roaring Twenties” market that got underway in August 1921 and topped in September 1929. That bull market lasted 97 months. Today’s market has already surpassed 97 months in April 2017. We are now in the 99th month. The “Roaring Twenties” market wasn’t even the longest. The 1990s’ market got underway in October 1990 and lasted until January 2000 or 112 months. Who knows? Maybe we have another year to go on this one too. For the record, the one significant correction in the 1990s only lasted a month and a half, but it did shave 19.3% off the Dow Jones Industrials (DJI).
It is not unusual for bull markets to end in a blow-off. These are the points in time when the market just keeps going up and nothing makes any sense. It may be a correct assessment but the shorts can go bankrupt during these periods. Blow-offs always occurs at the end of the cycle and usually come after a long period of time when the market has been moving inexorably higher.
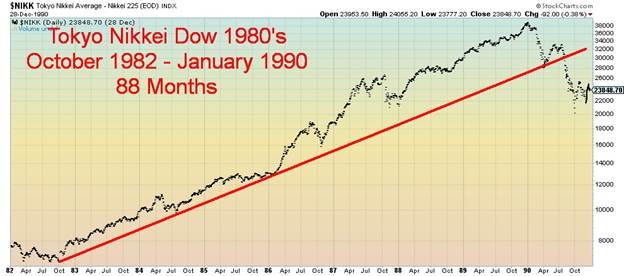
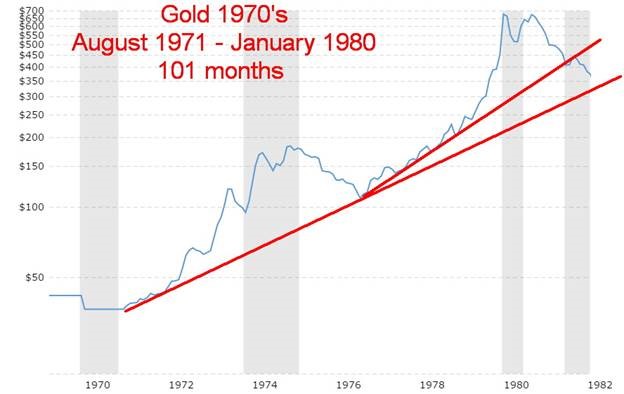
There are numerous examples in the past. The best ones are: the “Roaring Twenties” 1921–1929 that really got underway in late 1926, culminating in the blow-off top into September 1929; the gold market of the 1970s (1971–1980) that ended in a blow-off that started in April 1979 and ended in January 1980; the Tokyo Nikkei Dow of the 1980s (1982–1990) that ended in a blow-off into January 1990; the 1990s High Tech/Internet market (1990–2000) and subsequent blow-off known as the Dot-com bubble that started in October 1999 and ended for the Dow Jones Industrials (DJI) in January 2000, and, for the Nasdaq and the S&P 500 in March 2000.
Source: www.macrotrends.net
The bull market of the “Roaring Twenties” was one of the greatest bull markets in stock market history. From August 1921 to the top in September 1929, the DJI gained 497%. There was only one correction of significance during that period. In 1923, the DJI corrected back 18.6% and then chopped around into May 1924. After that, things really heated up. But it was the final liftoff that was most impressive. From June 1928 to the top in September 1929, the DJI gained 80%. Like all blow-offs and all massive bull markets it ended in tears. Over the next three years until July 1932 the DJI collapsed 89% and the US and the world was gripped in the “Great Depression.” It wasn’t until 1954 that the DJI finally passed the September 1929 high.
The Tokyo Nikkei Dow (TKN) was an equally spectacular bull market. The TKN bull had its start in October 1982 and over the next eight years gained 470%. The October 1987 stock market crash saw the TKN shed 21%. That was the only correction of significance during the entire period. From the low in November 1987 to the final top in January 1990, the TKN soared 85%. As with the DJI of the “Roaring Twenties,” it ended in tears. Twenty-seven years later the TKN still has not regained the highs of January 1990 as it is still down 48%. At its lowest in October 2008, the TKN was down 82%. Since that spectacular bull market, Japan has been going through what has been termed Japan’s long recession, twenty-seven years of sluggish growth and/or recessionary conditions. No matter what they do, they cannot seem to pull themselves out of it.
Source: www.stockcharts.com
Long bull markets that end with blow-offs always seem to end in tears. And none was more spectacular than the gold bull market of the 1970s. After Richard Nixon took the world off the gold standard in August 1971 setting gold to trade freely the rise seen over the next eight and half years can only be termed as spectacular. Gold rose from its fixed price of $35/troy ounce to a peak of $873/troy ounce in January 1980 a gain of 2,395%. During that period the only significant correction was from November 1974 to August 1976 when gold fell roughly 50%. The spectacular part of the up move got underway in April 1979 and saw gold gain over 300% in just nine months. As to the tears, well, the bear market for gold lasted until February 2001, a period of 21 years. Gold lost 70% in all during that period but the good news was it was still up over 600% from August 1971. It took until 2008 for gold to surpass its 1980 high. Today, gold remains 43% above that 1980 high and gold has been the best performing asset since 2000 despite a five-plus-year bear market that is still not officially over. And some still call gold a barbarous relic. But remember, unlike paper assets (stocks and bonds) gold lasts forever.
Source: www.macrotrends.net
In terms of length, the 1990s High Tech/Internet bull has thus far been the granddaddy of all bull markets. The bull got underway in October 1990 although some may argue that the bull really got underway following the 1987 stock market crash. The 1990 correction saw the DJI lose 21.2% barely qualifying it as a bear market. It only lasted three months and much of it was triggered by Iraq’s invasion of Kuwait. However, a recession did follow so, while short and shallow it still qualifies given it exceeded a 20% drop in the markets.
The 1990s’ bull lasted until January 2000 for the DJI while the Nasdaq and the S&P 500 didn’t top out until March 2000. Along the way was the 1998 scare triggered by the Russian default and the near collapse of Long Term Capital Management (LTCM) a hedge fund that employed “mind-boggling” leverage. The LTCM collapse was so bad it almost brought down the financial system. Well almost, as the Fed stepped in and effectively bailed out the system with a massive cut in interest rates and they poured billions in liquidity into the market propping up the major financial institutions to prevent an outright collapse. That in turn steadied the stock markets and the DJI only fell 19.3% missing the 20% mark for an official bear market.
All in all the 1990s’ bull saw the DJI gain 396% leaving it short of the gains of both the DJI of the “Roaring Twenties” and the Japanese market of the 1980s. But in terms of length it might not ever be seen again. Unless the current bull has even more life.
As to it ending in tears, well, the 2000–2002 High Tech/Internet crash shed about 38% from the DJI but the real carnage was over at the Nasdaq.
Source: www.stockcharts.com
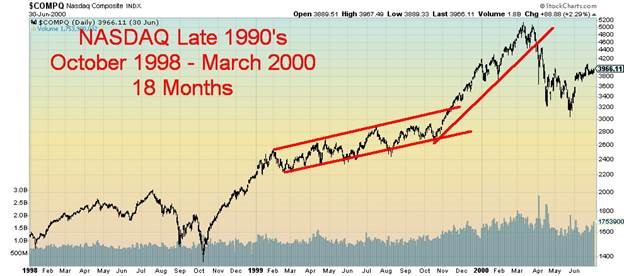
The High Tech/Internet crash of 2000–2002 left a lot in tears and a lot of companies that simply disappeared. The collapse was also known as the Dot-com bubble and bust. We are sure people remember names like Pets.com, Qualcomm, Nortel Networks, WorldCom and Enron. During the bubble period, valuations and price/earnings (PE) reached insane levels. Most of the companies didn’t make any money, spent lavishly, and the buzzword phrase was growth over profits. The Nasdaq was where most of these companies were listed and as a result the Nasdaq soared from 323 in October 1990 to 5,132 by March 2000 a gain of 1,489%. As to the tears well the Nasdaq fell 78% in the Dot-com bust and as noted many companies simply disappeared.
One of the interesting aspects of the Nasdaq bubble was a steady rise punctuated by sharp ups and downs occurring from January 1999 to September 1999. It was during that period that the calling became shrill that the Nasdaq was going to crash. Except it didn’t and the final bubble rise took place as the Nasdaq gained 88% from the final low in September 1999 to the March 2000 top. By May 2000 the Nasdaq had already shed just over 2,000 points with a lot more shedding to come. It wasn’t until 2016 that the Nasdaq finally surpassed its 2000 top.
Source: www.stockcharts.com
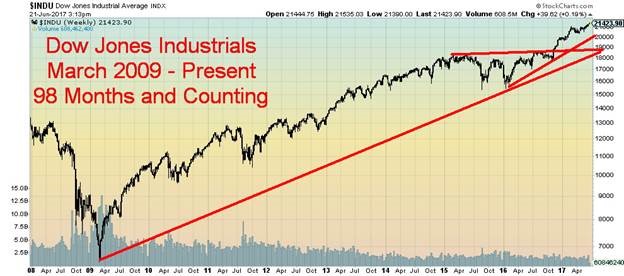
That brings us to today’s market. The stock markets have been rising for 98 months and counting. The DJI has gained 231%, which is actually not that spectacular when one compares it to the “Roaring Twenties” market, the Nikkei Dow market of the 1980s or even the 1990s’ High Tech/Internet bubble. The market has followed a lengthy period of up and down action from roughly May 2015 until the market broke out to new highs in November 2016 following the election. Since then the market has continued to work its way higher despite numerous negatives in the background.
Source: www.stockcharts.com
We have read numerous reports about how this market is overvalued, how a crash is coming that could wipe out up to 70% of its value, how a devastating worldwide recession is about to hit, and that the market is a bubble waiting to burst. They call this bubble the “everything” bubble. It is the third bubble since 2000 following the Dot-com bubble and the housing bubble. But if this one is to be a true bubble then we need to hit the point where the market is going up almost every day and everyone is talking about it and telling us how it is never going to end. We haven’t hit that point, yet.
The market keeps rising. That is despite –
- the Fed hiking interest rates
- the ongoing political machinations in Washington with a President under siege and investigation
- the ongoing wars in the Mid-East, a war taking a potentially more dangerous turn following the shooting down of a Syrian warplane by the US and Russia effectively saying they will impose a no-fly zone over Syria
- a global economy that continues with sluggish growth
- a rise in violent clashes in the US between citizens and police and leftist and rightist groups, and,
- overvaluations in the market.
The market keeps moving higher despite the numerous reasons as to why it should fail. But probably the biggest reason the market keeps moving higher is because of the immense expansion of credit over the past eight years. Debt, globally, has been growing faster than economic growth especially in China. As long as debt keeps on expanding and can be serviced markets could keep on rising. Debt collapse brought on the 2008 financial crash and history is replete with debt related collapses sparking panics, recessions, depressions, civil wars, and wars.
Is there any reason to suspect “this time it will be different”? Probably not. The question is when, not if. Long bull markets have historically had a tendency not to end with a whimper but with a bang—a blow-off followed by a crash and tears. These are good reasons to suspect that a blow-off could come sooner than we suspect. It will most likely be an exciting ride. The cab driver will probably be giving you the latest stock recommendations just as they did in previous blow-offs. Just don’t forget to get out of the cab.
Disclaimer: David Chapman is not a registered financial advisor, nor an exempt market dealer (EMD). We do not and cannot give individualized market advice. The information in ...
more

