
Bitcoin Price Surges 57% Off Monthly Lows- Bullish Breakout Potential
It’s been a volatile start of the year for Bitcoin with the cryptocurrency plummeting a staggering 70% off the record highs set in December before rebounding sharply last week. The recovery is now approaching initial resistance and our focus over the next few days will be on breakout of the February opening range.
BITCOIN DAILY PRICE CHART (LOG)
(Click on image to enlarge)
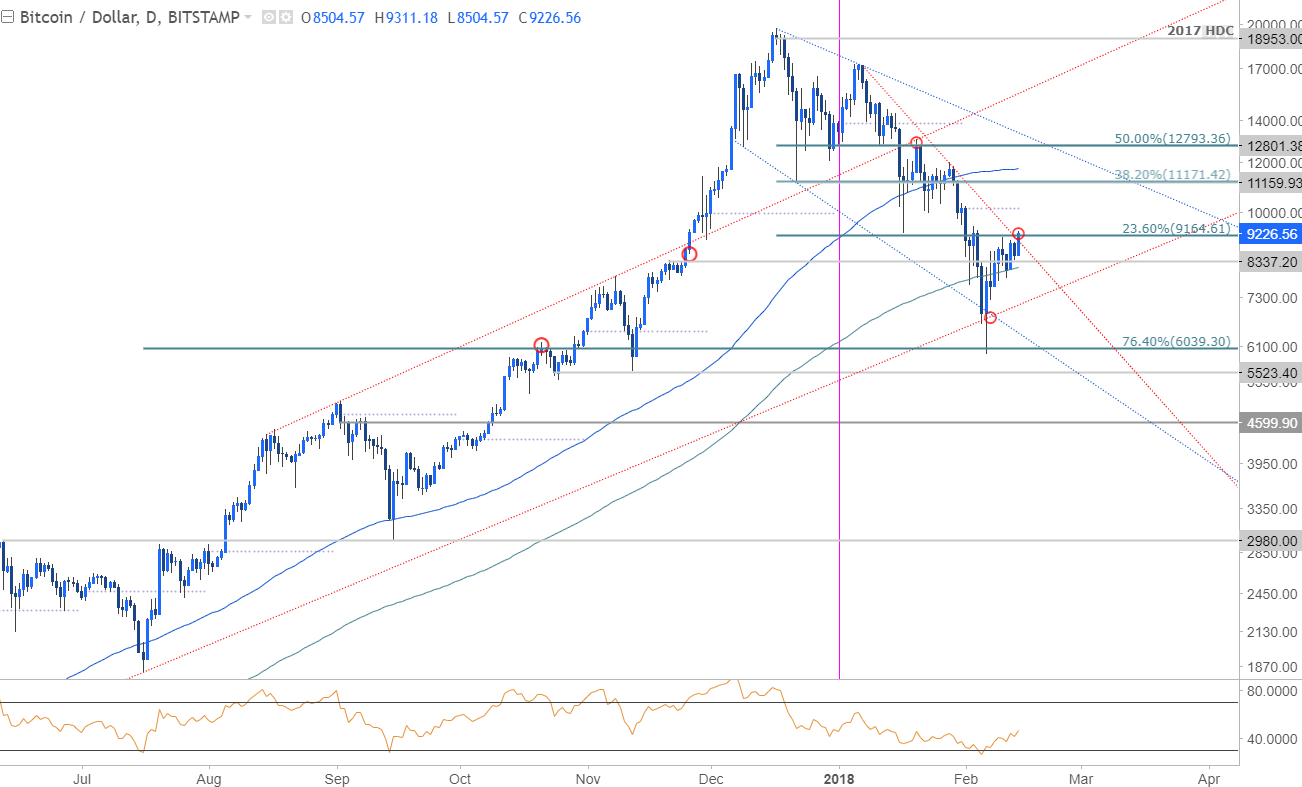
Technical Outlook: Bitcoin prices rebounded sharply early in the month off the 76.4% retracement of the July advance at 6039 with the rebound attempting to breach above confluence resistance today at 9164. A close above this threshold would alleviate further downside pressure near-term with such a scenario targeting monthly open resistance at 10149 backed by the 12/22 swing low / 38.2% retracement at 11171.
Interim support rests with the 200-day moving average – a break there would once again look to challenge the March uptrend slope support around 7100. Key support remains steady at 6039.
BITCOIN 240MIN PRICE CHART (LOG)
(Click on image to enlarge)
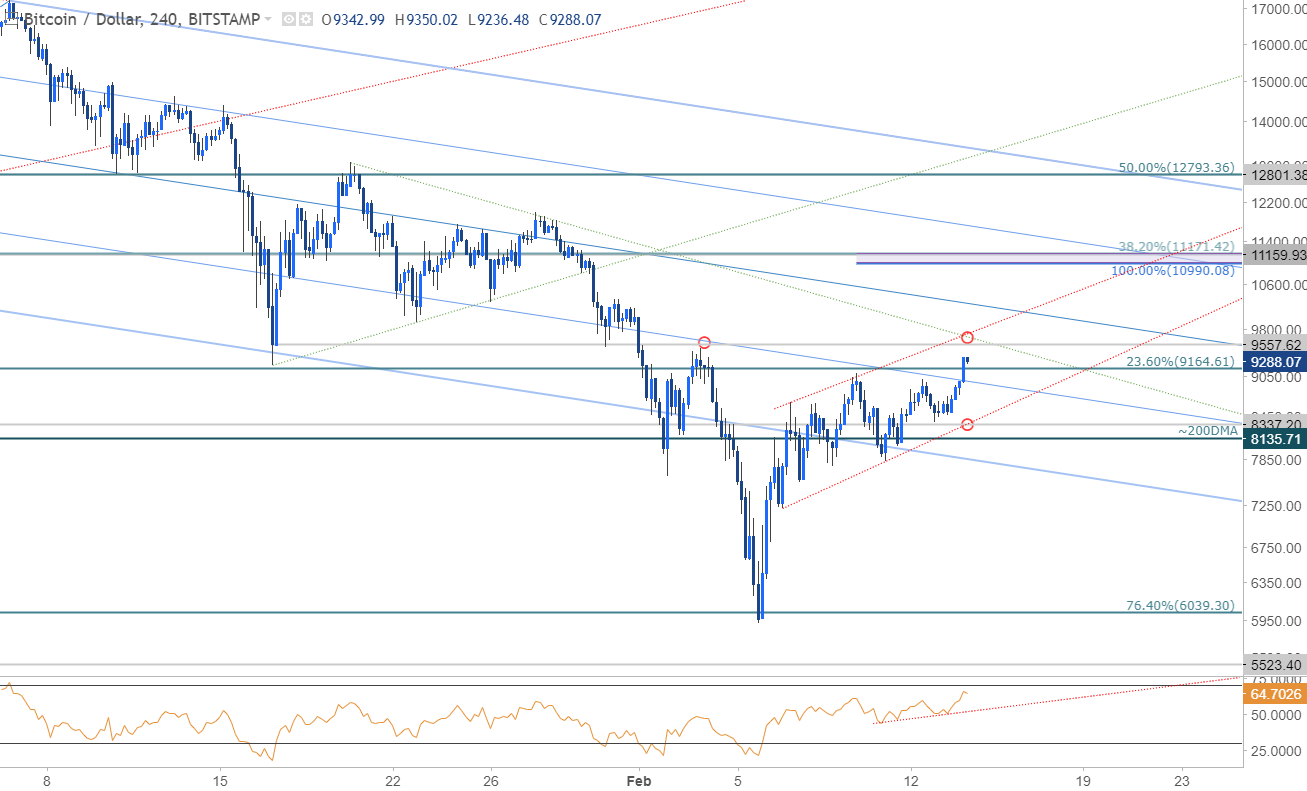
Notes: A closer look at price action sees Bitcoin trading within the confines of a near-term ascending channel formation with interim confluence resistance eyed around 9557-9715. The immediate advance may be vulnerable heading into this region near-term, but the focus remains higher for now while above 8337.
Near-term bullish invalidation rests at 8135 with a break there shifting the focus back towards the monthly lows. Bottom line: the focus remains higher near-term while above 8135 with a breach above a 9715 needed to fuel the next leg higher in price. From a trading standpoint, I’m looking higher near-term with the rally to ultimately offer better short-entries higher up near 10990-11171.
BTC/USD IG CLIENT SENTIMENT
(Click on image to enlarge)
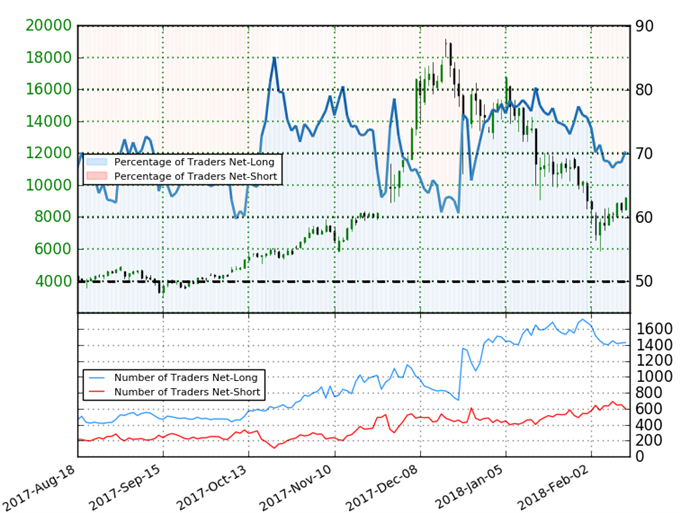
- A summary of IG Client Sentiment shows traders are net-long BTCUSD- the ratio stands at +2.37 (70.3% of traders are long) – bearish reading
- Long positions are 1.3% higher than yesterday and 4.2% lower from last week
- Short positions are7.7% lower than yesterday and 1.0% higher from last week
- We typically take a contrarian view to crowd sentiment, and the fact traders are net-long suggests Bitcoin prices may continue to fall. Retail is more net-long than yesterday but less net-long from last week. The combination of current positioning and recent changes gives us a further mixed Bitcoin trading bias from a sentiment standpoint.


