
Bitcoin-Bulls Pray This Support Holds, Says Joe Friday
(Click on image to enlarge)
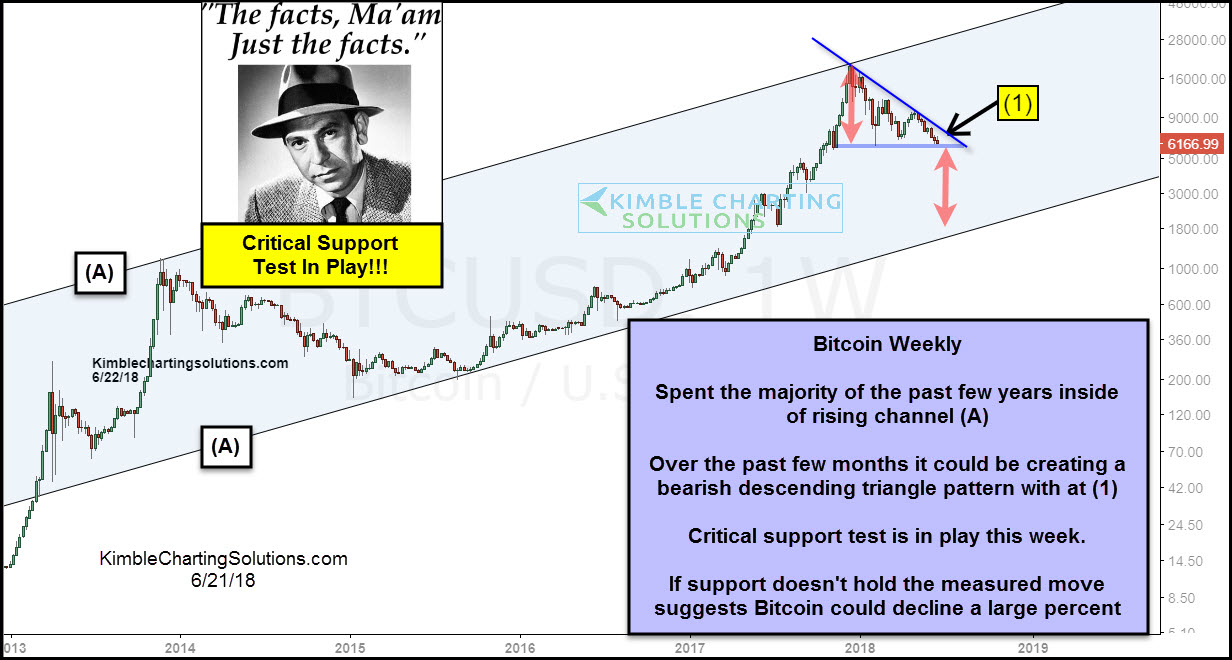
This chart looks at Bitcoin over the past 5-years. The long-term trend remains up as it has spent the majority of the time inside of rising channel (A) since 2013.
The rally in Bitcoin saw it hit the top of the channel 7 months ago and since then it has created a series of lower highs. While creating the lower highs a series of flat bottoms have come into play, forming what could be a bearish descending triangle pattern.
At this time, Bitcoin is testing support and support is support until broken.
Just The Fact Ma’am – If support breaks, the measured move suggest Bitcoin could fall a large percent. Bitcoin bulls are praying this support holds!
Sign up for Chris's Kimble Charting Solutions' email alerts--click here.
How did you like this article? Let us know so we can better customize your reading experience.

Comments
Leave a comment to automatically be entered into
our contest to win a free Echo Show.

