
Best Semiconductor Stocks: Consider Applied Materials
Semiconductor companies have done very well in the last year. In fact, the PHLX Semiconductor Sector Index (SOX) is up 39.9% year to date, while the S&P 500 Index has increased 10.8%, and the Nasdaq Composite Index has gained 9.1% in this period. As I see it, semiconductor stocks are going to continue outperforming the broad market in the next few quarters.
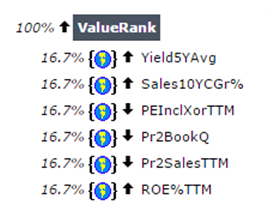
A Ranking system sorts stocks from best to worst based on a set of weighted factors. Portfolio123 has a ranking system which allows the user to create complex formulas according to many different criteria. They also have highly useful several groups of pre-built ranking systems, I used one of them the "ValueRank" in this article.
The "ValueRank" ranking system is quite complex, and it is taking into account factors like; five years average yield, ten years compounded sales growth, the latest price to book ratio, the trailing twelve month PE, price to sales, and ROE%, as shown in Portfolio123’s chart below.
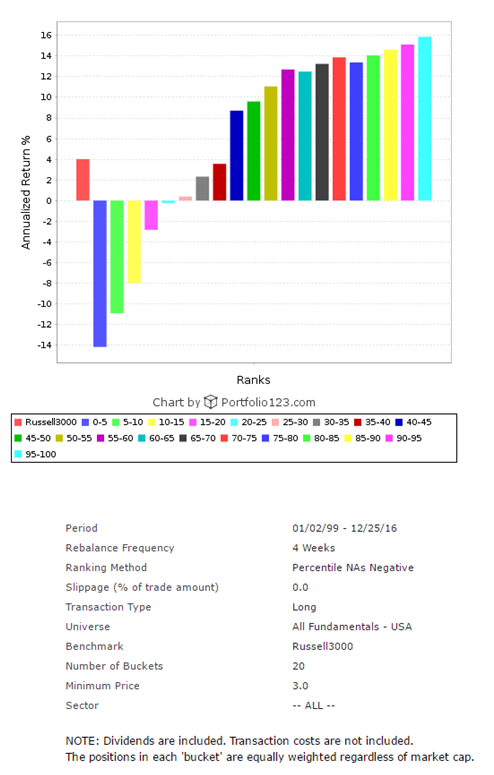
In order to find out how such a ranking formula would have performed during the last 18 years, I ran a back-test, which is available by the Portfolio123's screener. For the back-test, I took all the 6,218 stocks in the Portfolio123's database.
The back-test results are shown in the chart below. For the back-test, I divided the 6,218 companies into twenty groups according to their ranking. The chart clearly shows that the average annual return has a very significant positive correlation to the "ValueRank" rank. The highest ranked group with the ranking score of 95-100, which is shown by the light blue column in the chart, has given by far the best return, an average annual return of 15.9%, while the average annual return of the Russell 3000 index during the same period was 4.0% (the red column at the left part of the chart). Also, the second and the third group (scored: 90-95 and 85-90) have given superior returns. This brings me to the conclusion that the ranking system is very useful.
After running the "ValueRank" ranking system on all Russell 3000 Semiconductor stocks on December 25, I discovered the twenty best stocks, which are shown in the table below. In this article, I will focus on the first-ranked stock; Applied Materials (AMAT).

Applied Materials
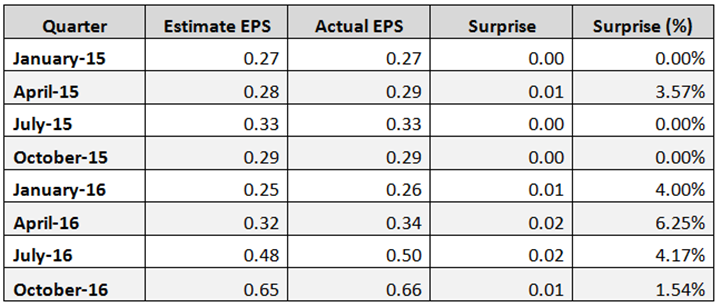
On November 17, Applied Materials reported its fourth quarter fiscal 2016 financial results, which beat EPS expectations by $0.01 (1.5%). Applied's revenues of $3.30 billion for the quarter were up 39% year over year while EPS of $0.66 increased 128% from the same quarter a year ago. The company showed earnings per share surprise in its last four quarters, after meeting estimates in its two previous quarters, as shown in the table below.
In the report, Gary Dickerson, president and CEO, said:
“In fiscal 2016, we grew orders, revenue, and earnings to the highest levels in the company’s history, and made significant progress towards our longer-term strategic and financial goals. We’ve focused our organization and investments to deliver highly differentiated solutions that enable customers to build new devices and structures that were never possible before.”
In my view, it is very impressing that the company received new orders of $12.42 billion in its fiscal 2016, a 23% increase year over year. What's more, its adjusted gross margin increased 3.0% to 43.2%, and its earnings per share grew 47% compared to the previous year to $1.75.
Applied Materials Stock Performance
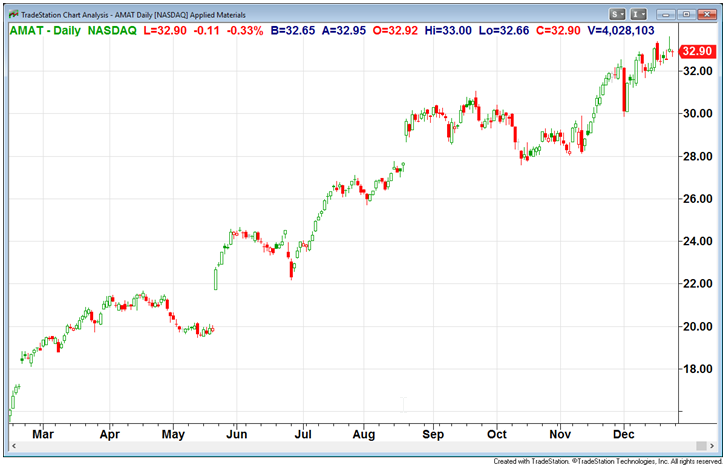
Since the beginning of the year, AMAT's stock is already up 76.2% while the S&P 500 Index has increased 10.8%, and the Nasdaq Composite Index has also increased 9.1%. Moreover, since the beginning of 2012, AMAT's stock has gained an impressive 207.2%. In this period, the S&P 500 Index has increased 80%, and the Nasdaq Composite Index has risen 109.7%. According to TipRanks, the average target price of the top analysts is at $33.86, which indicates an upside of 2.9% from its December 23 close price, however, in my opinion, shares could go higher.
AMAT Daily Chart
AMAT Weekly Chart
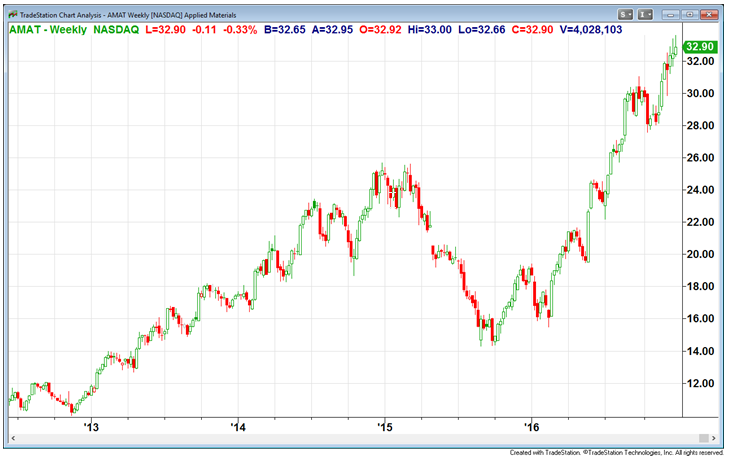
Charts: TradeStation Group, Inc.
Valuation
AMAT's valuation is good, the trailing P/E is at 21.36, and the forward P/E is low at 12.99. The price to free cash flow is at 20.44, the Enterprise Value/EBITDA ratio is at 13.79, and the PEG ratio is very low at 0.78. Applied has been paying uninterrupted dividends since 2007. The annual dividend yield is at 1.22%, and the payout ratio is only 25.5%.
Summary
Applied Materials delivered better than expected fourth quarter results and surprised the market by offering strong guidance for its first quarter fiscal 2017, much higher than analysts' expectation. AMAT's valuation is good; the PEG ratio is very low at 0.78. Moreover, AMAT's stock is ranked first among all 70 Russell 3000 Semiconductor stocks according to Portfolio123 "ValueRank" ranking system. All these factors bring me to the conclusion that AMAT's stock is a smart long-term investment.
Disclosure: I am long AMAT


